Outline 4.0 Results
- [x] 4.1 Global Connectivity Patterns
- [x] validation of seed regions (FEF, IFJa)
- [x] 4.2 Testing the “Where” Stream (FEF Connectivity)
- [x] Motion Areas reinnhemen MT/MST
- [x] 4.3 Testing the “What” Stream (IFJa Connectivity)
- [x] Strong connection to semantic system
- [x] vergleichen mit IFJp
- [x] vergleichen mit 44/45/47l
- [x] 4.4 Resolving Ambiguities
- [x] whether A5 aligns more with IFJ or FEF
- [x] PSL alignment
- [x] STV alignment
- [x] 4.5 Functional Roles of Adjacent Areas
- [x] 55b as alternative dorsal seed → couples with dorsal language network, not spatial/motion
- [x] 44 vs. 45 as seed regions → dissociation within Broca complex
- [x] suggests FEF drives spatial/motion-dorsal, 55b drives dorsal language stream
- [x] 4.6 Behavioural Prediction
4.0 Results
Our analyses reveal a clear functional dissociation between the auditory where- and what-streams at the level of their prefrontal top-down regulators. Partial correlation of the two seed regions FEF and IFJa shows a distinct connectivity that aligns with the proposed supramodal organisation. The FEF is selectively coupled to spatial-parietal and motor circuits, while IFJa is preferentially connected to the ventral semantic network and the Broca complex. This double dissociation is further supported by seed-specificity validations (FEF vs. 55b, IFJa vs. IFJp) and by the analysis of Broca’s areas 44 and 45.
All z-scores reported below are from partial correlation analyses unless otherwise stated. Effect sizes are reported as , the mean partial correlation coefficient across subjects. Full correlation results are discussed only where they show meaningful contrasts compared to the partial correlation pattern.
4.1 Global Connectivity Patterns
Before examining each stream individually, we assess the overall functional dissociation between the auditory ‘what’ and ‘where’ streams. Using full and partial correlation, we compare the connectivity profiles of the two prefrontal seed regions FEF and IFJa, and validate their anatomical specificity against neighbouring control seeds.
4.1.1 FEF vs. IFJa: Validation of Prefrontal Seed Regions
To validate the anatomical specificity of our seed regions, we compared their partial correlation connectivity fingerprints across both hemispheres.
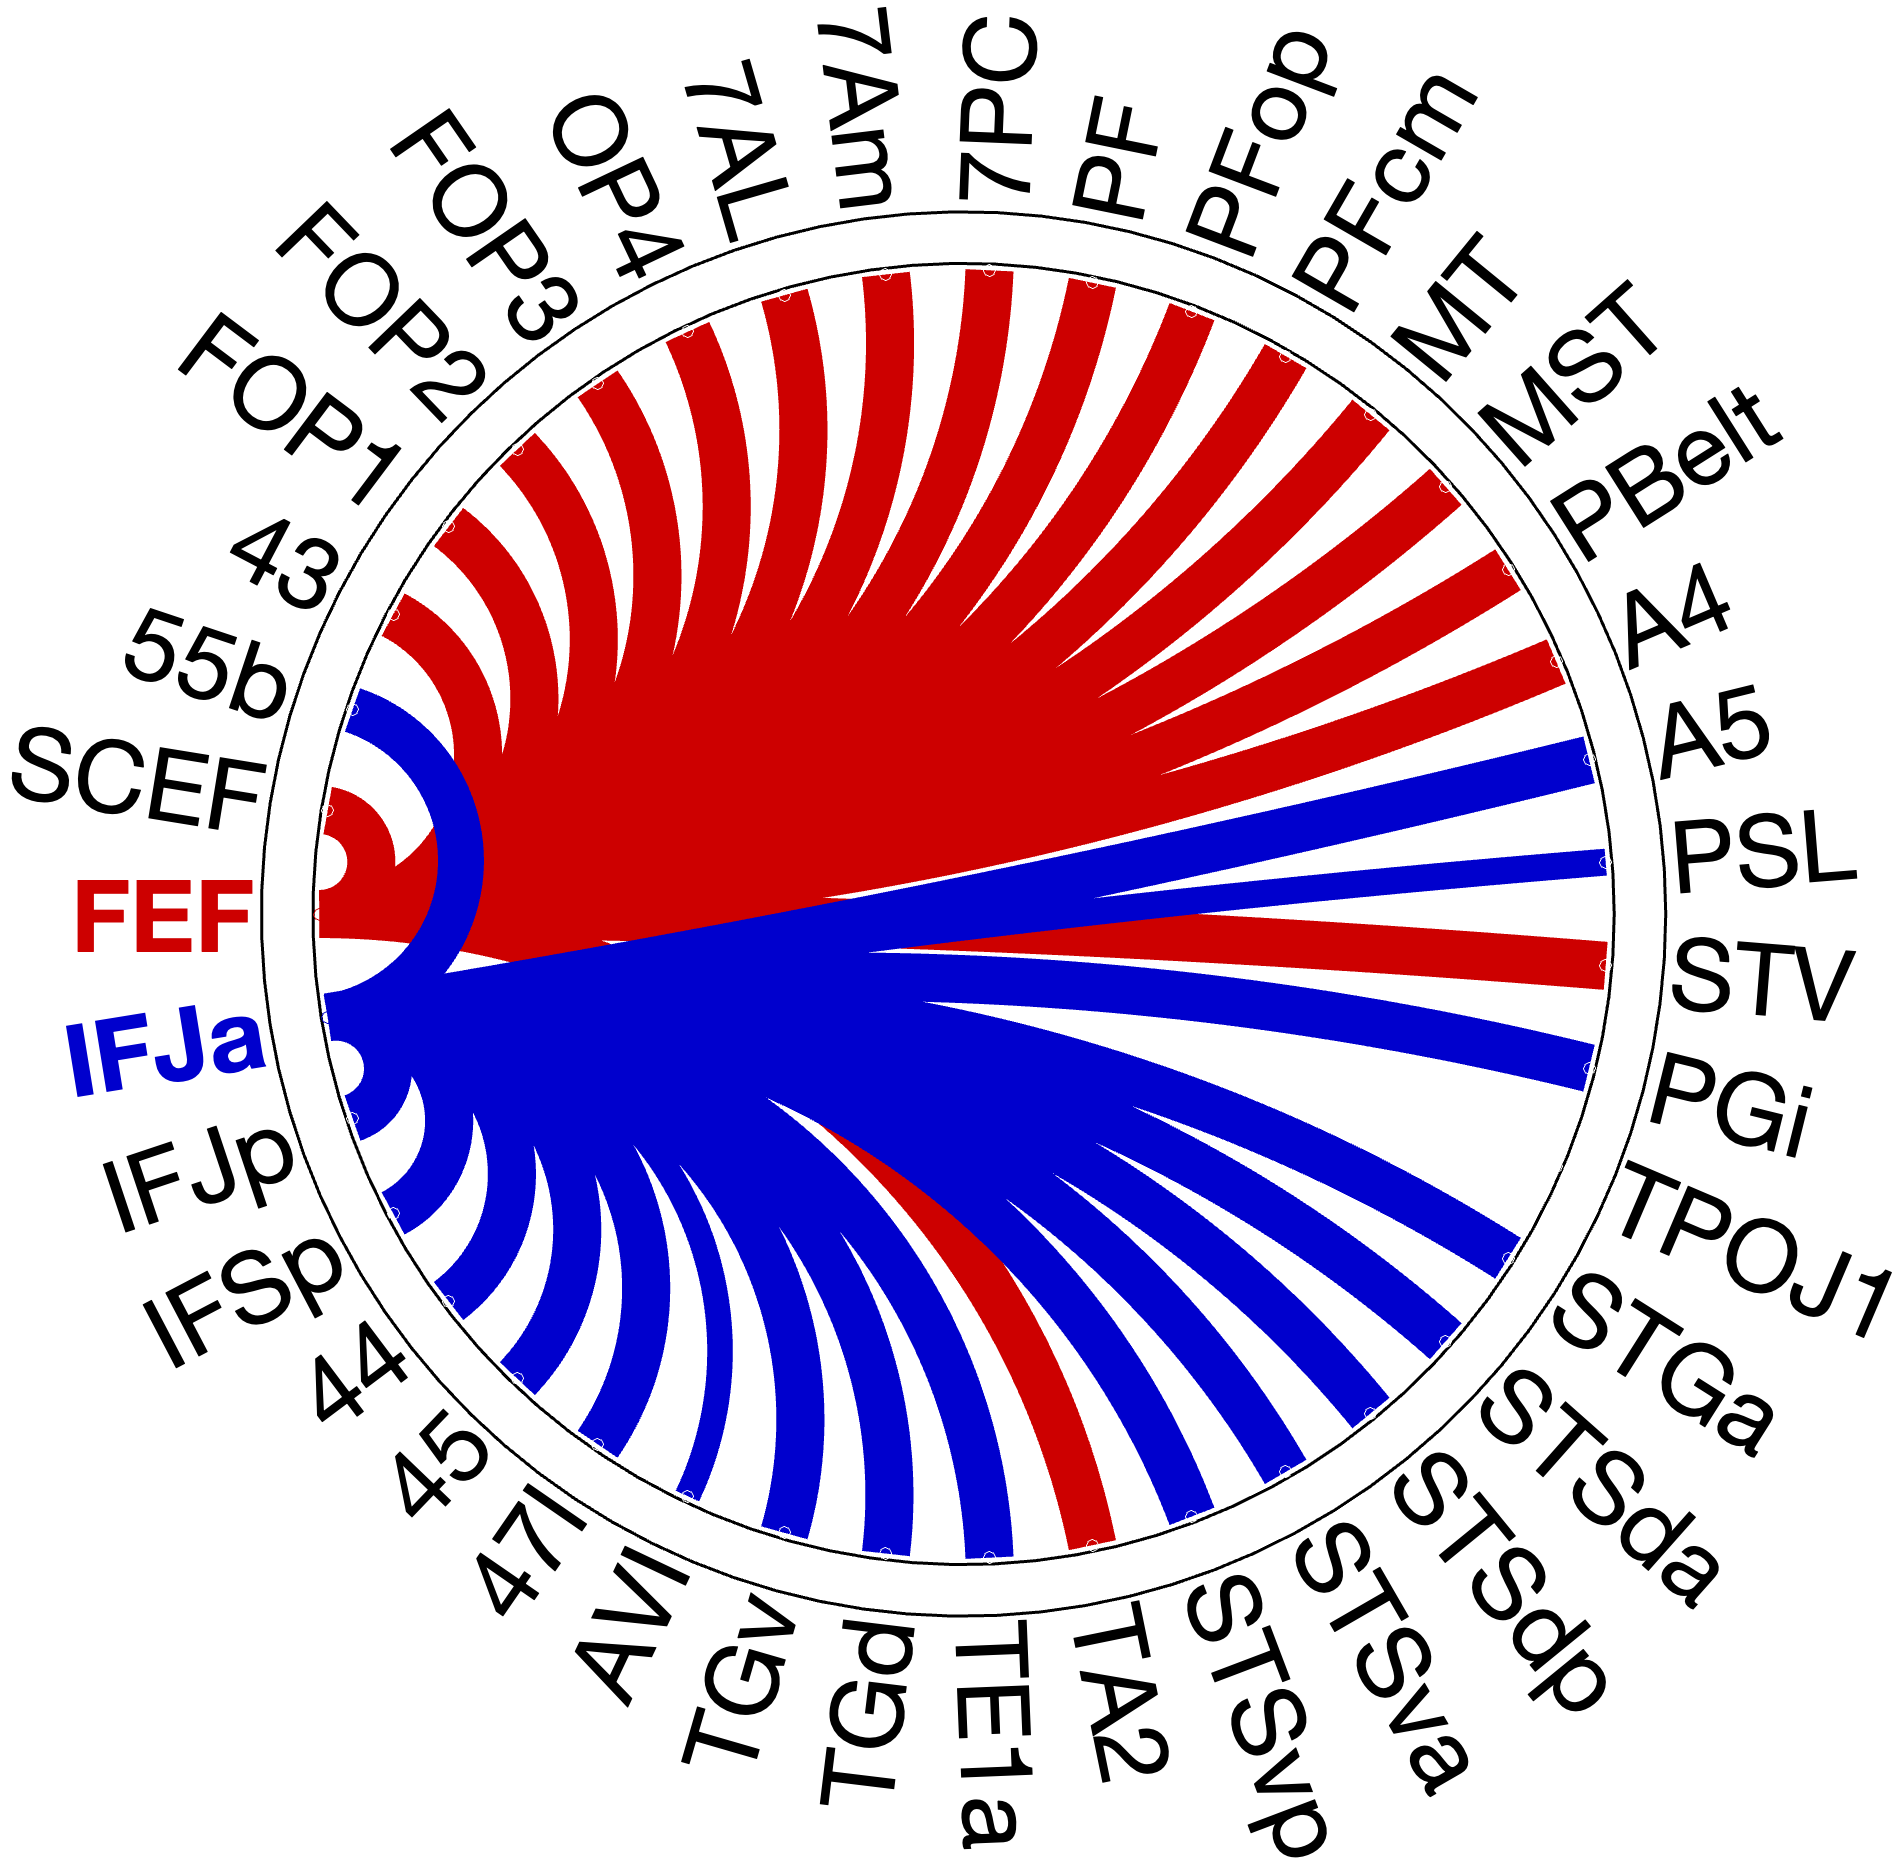
Figure 4.X: Circular connectivity diagrams comparing FEF (red) and IFJa (blue) full correlation with all auditory target ROIs, left (A) and right (B) hemisphere. The full correlation profiles reveal broad network-wide co-activation, including strong FEF coupling with superior parietal areas (7Am, 7PC, OP4) and IFJa coupling with temporal-semantic regions. These unpartialled patterns reflect general network membership and shared variance; partial correlation (Figure 4.X) isolates the direct functional pathways.The functional connectivity analysis with full correlation reveals a clear double dissociation with FEF significantly coupling with spatial-parietal areas (full corr.: OP4 , ; 7Am , ; 7PC , ; RH) with exceptions of FEF coupling with TA2 (full corr.: , ; RH) stronger than IFJa and TA2 and 55b connecting stronger to IFJa than to FEF.
Then we applied partial correlation to partial out third party connectors to see a clear picture of the connectivity patterns within the auditory streams. The partial correlation analysis reveals that the most direct auditory connections to FEF are consistently rooted in the spatial orienting network. Both hemispheres show strong coupling with the inferior parietal cluster (PF, PFop, PFcm). However, the network shows a distinct right-hemispheric dominance in specific regions, consistent with widely accepted right-lateralisation framework for spatial auditory processing (Hickok & Poeppel, 2007). While the left hemisphere dominates in FOP3 (, ), 7Am (, ) and 7PC (, ), the right hemisphere demonstrates a clear dominance in PF (right , ; left , ) and shows partial correlation with the perisylvian language area (PSL, , ), suggesting a stronger specialised right-lateralized fronto-parietal integration for spatial auditory processing (Hickok & Poeppel 2007 - Nature).
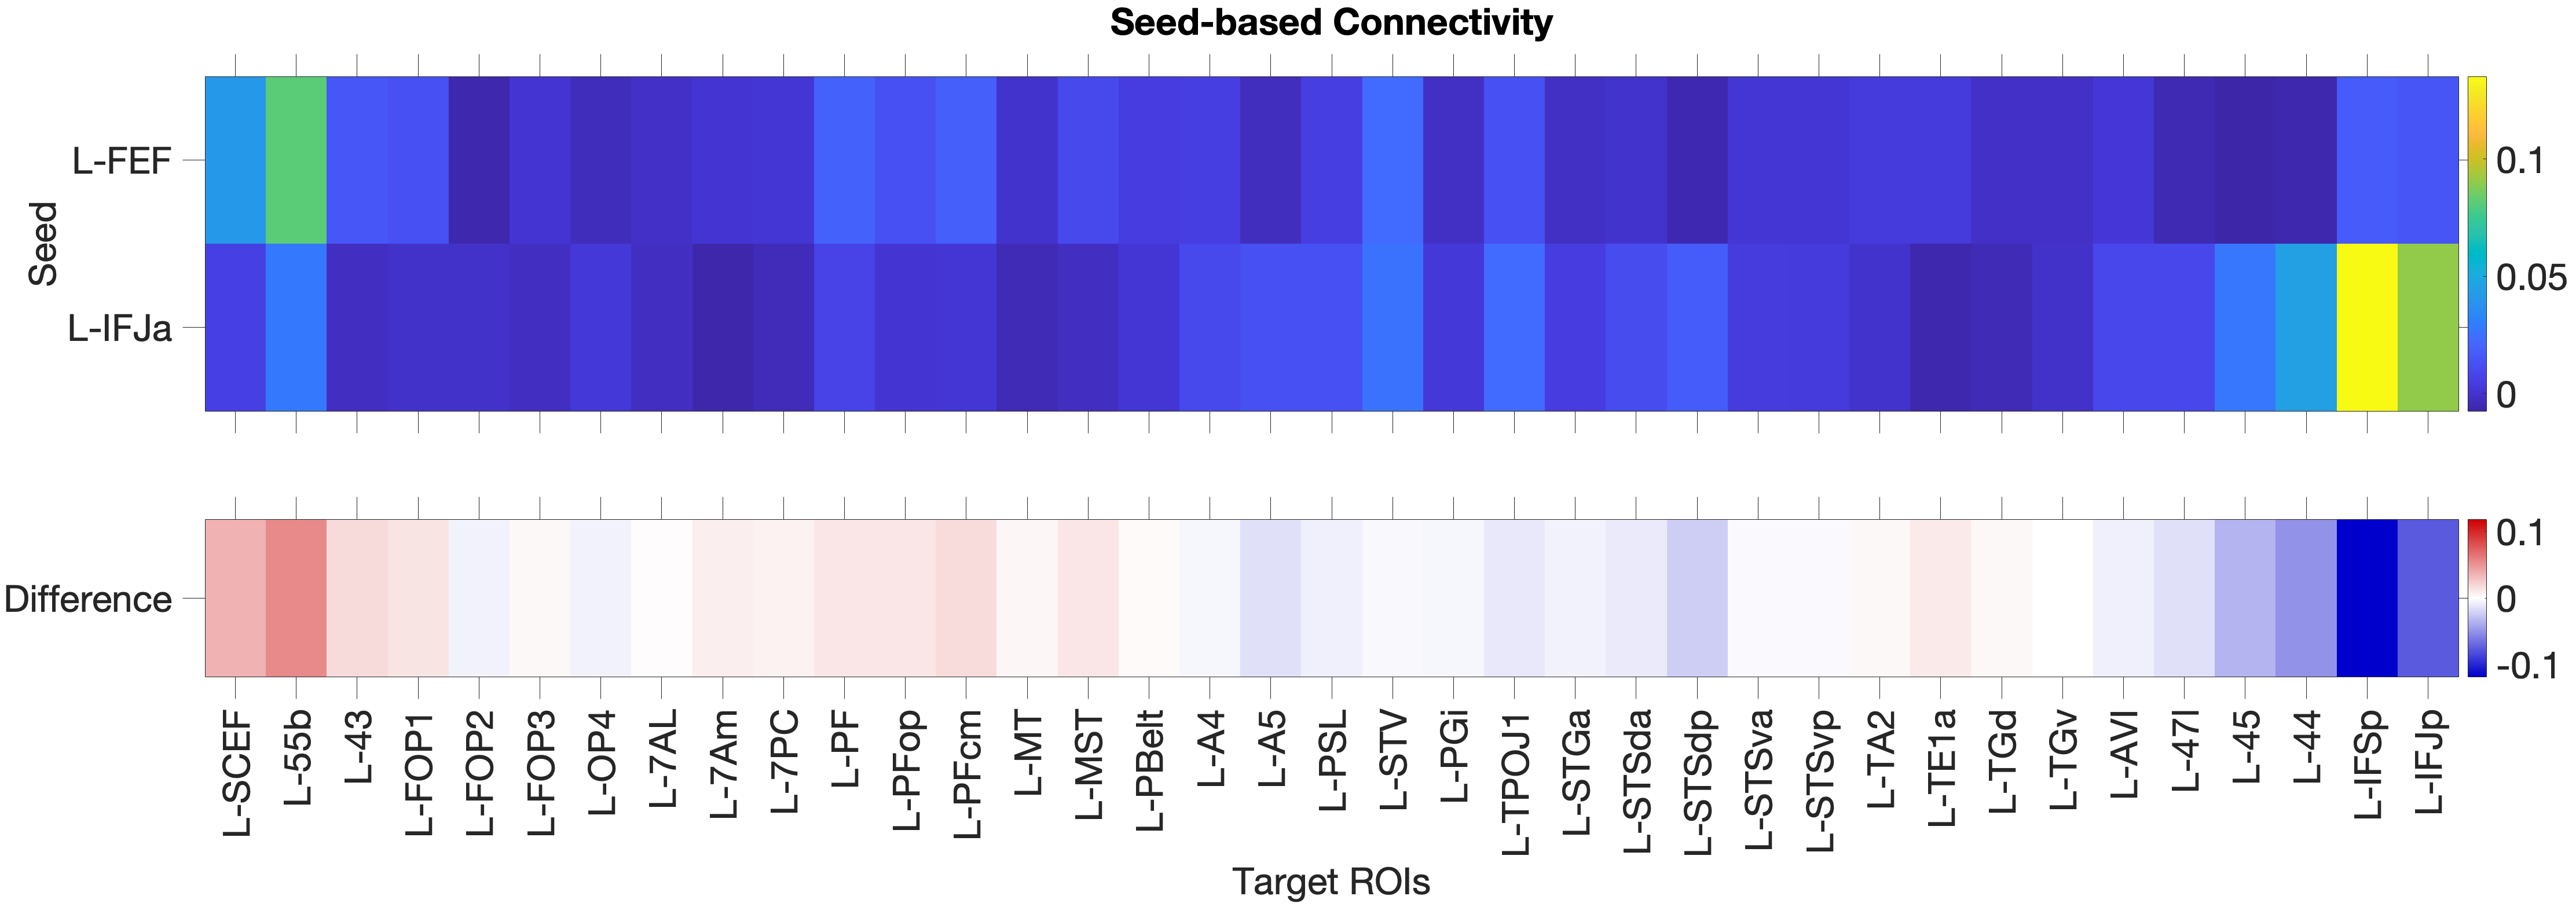
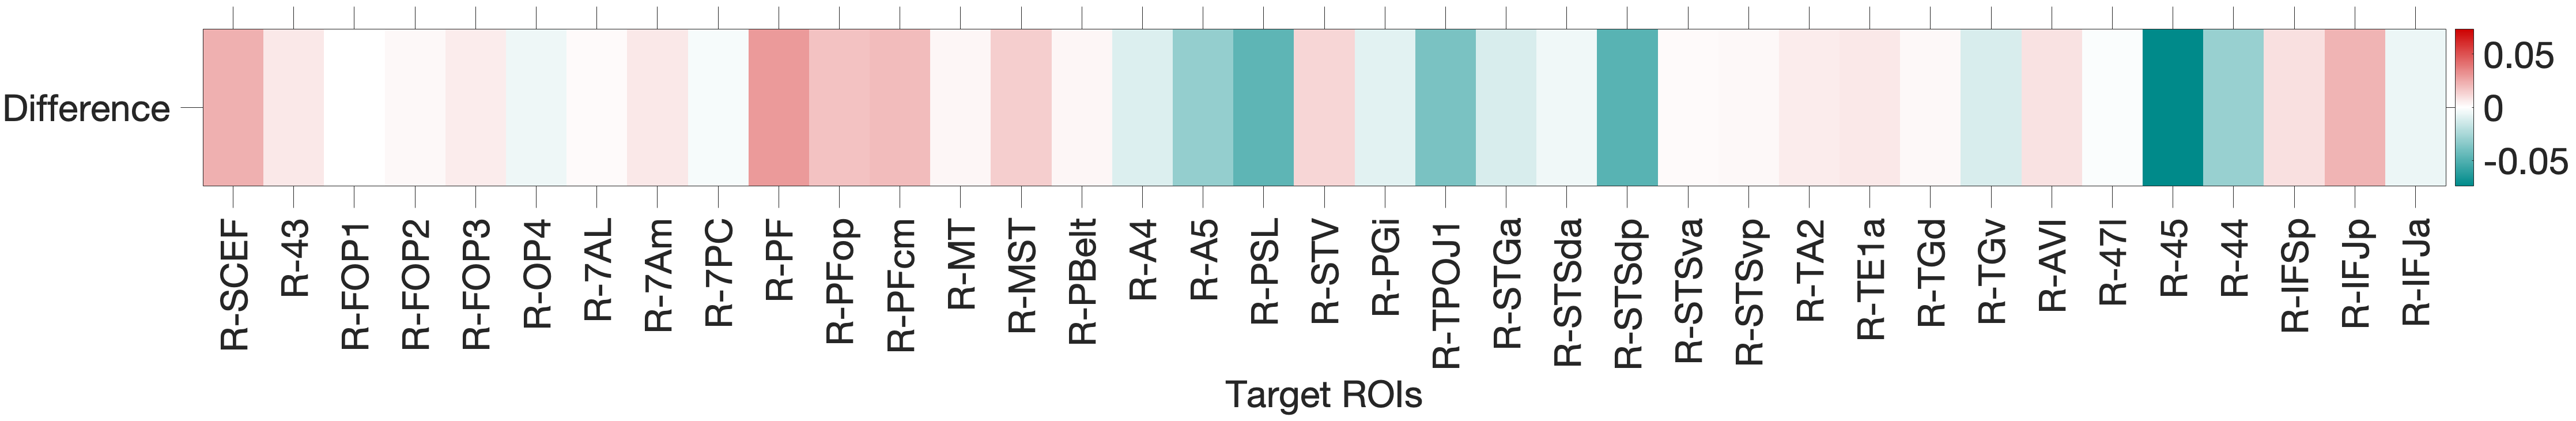
Figure 4.1: Functional connectivity heatmap comparing FEF and IFJa partial correlation z-scores across 36 auditory target ROIs, left hemisphere. Warm colours (yellow-orange) indicate positive coupling; cool colours indicate near- zero or negative coupling. The opposing colour patterns between FEF and IFJa rows reveal the double dissociation: FEF couples preferentially with spatial-parietal and motor regions, while IFJa couples preferentially with temporal-semantic regions.
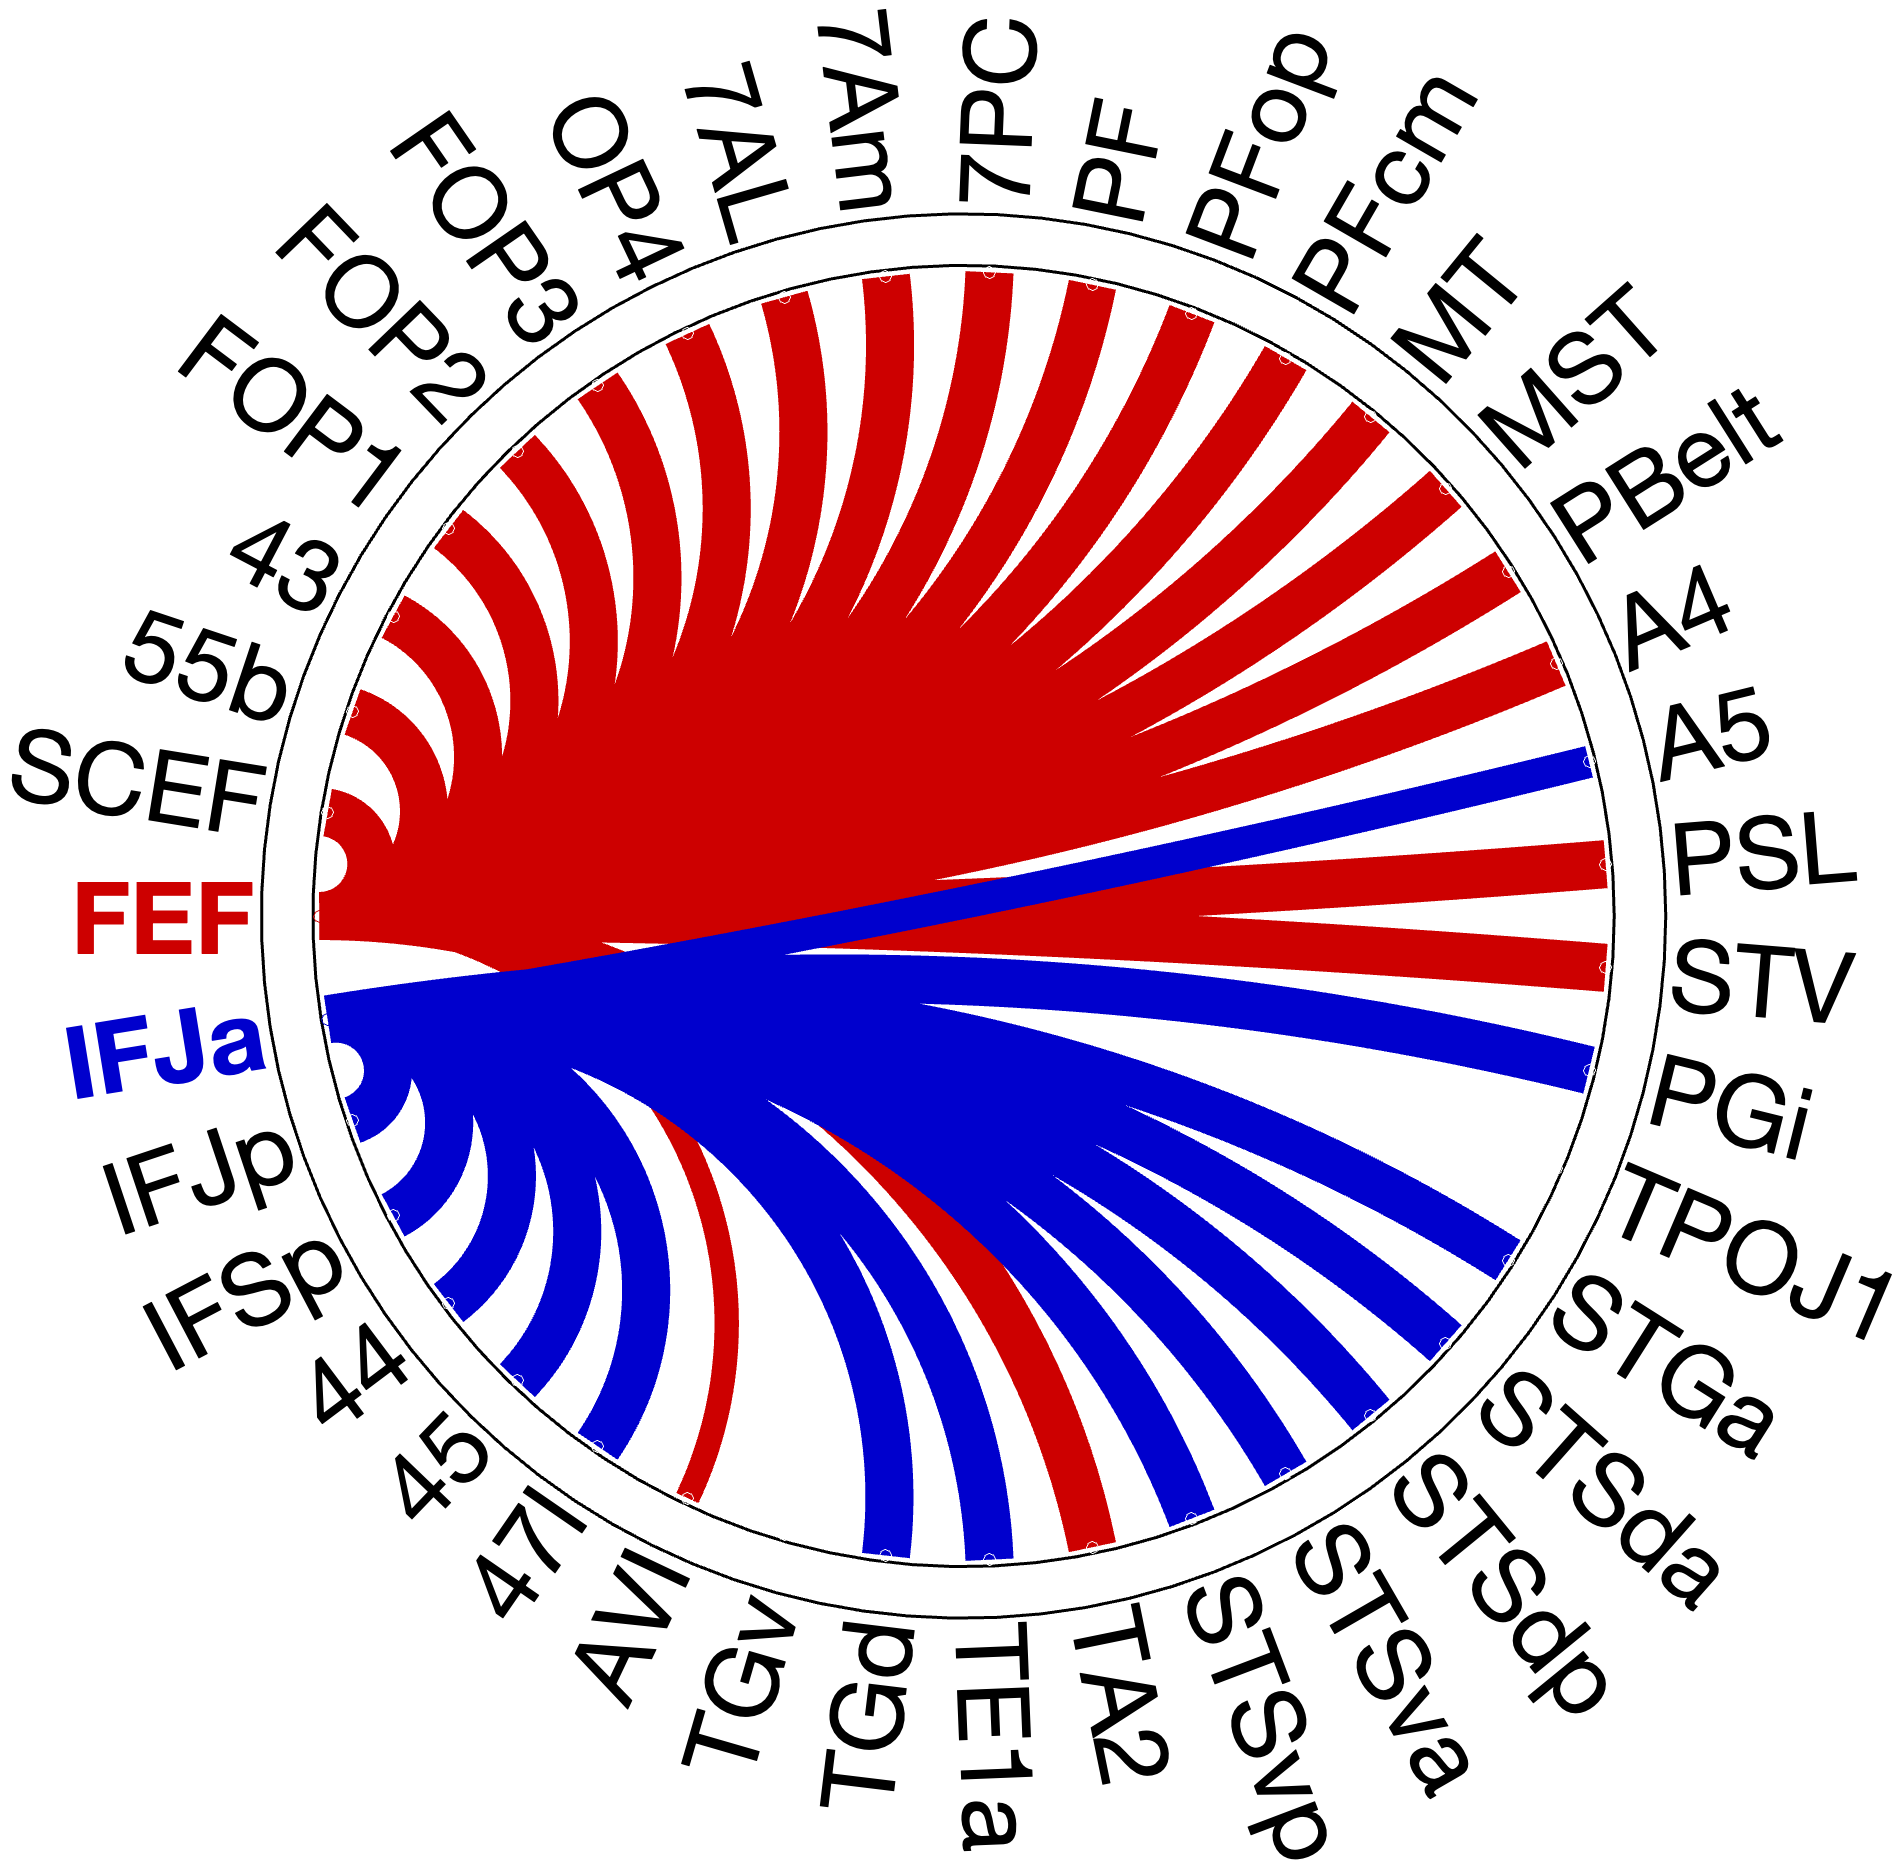
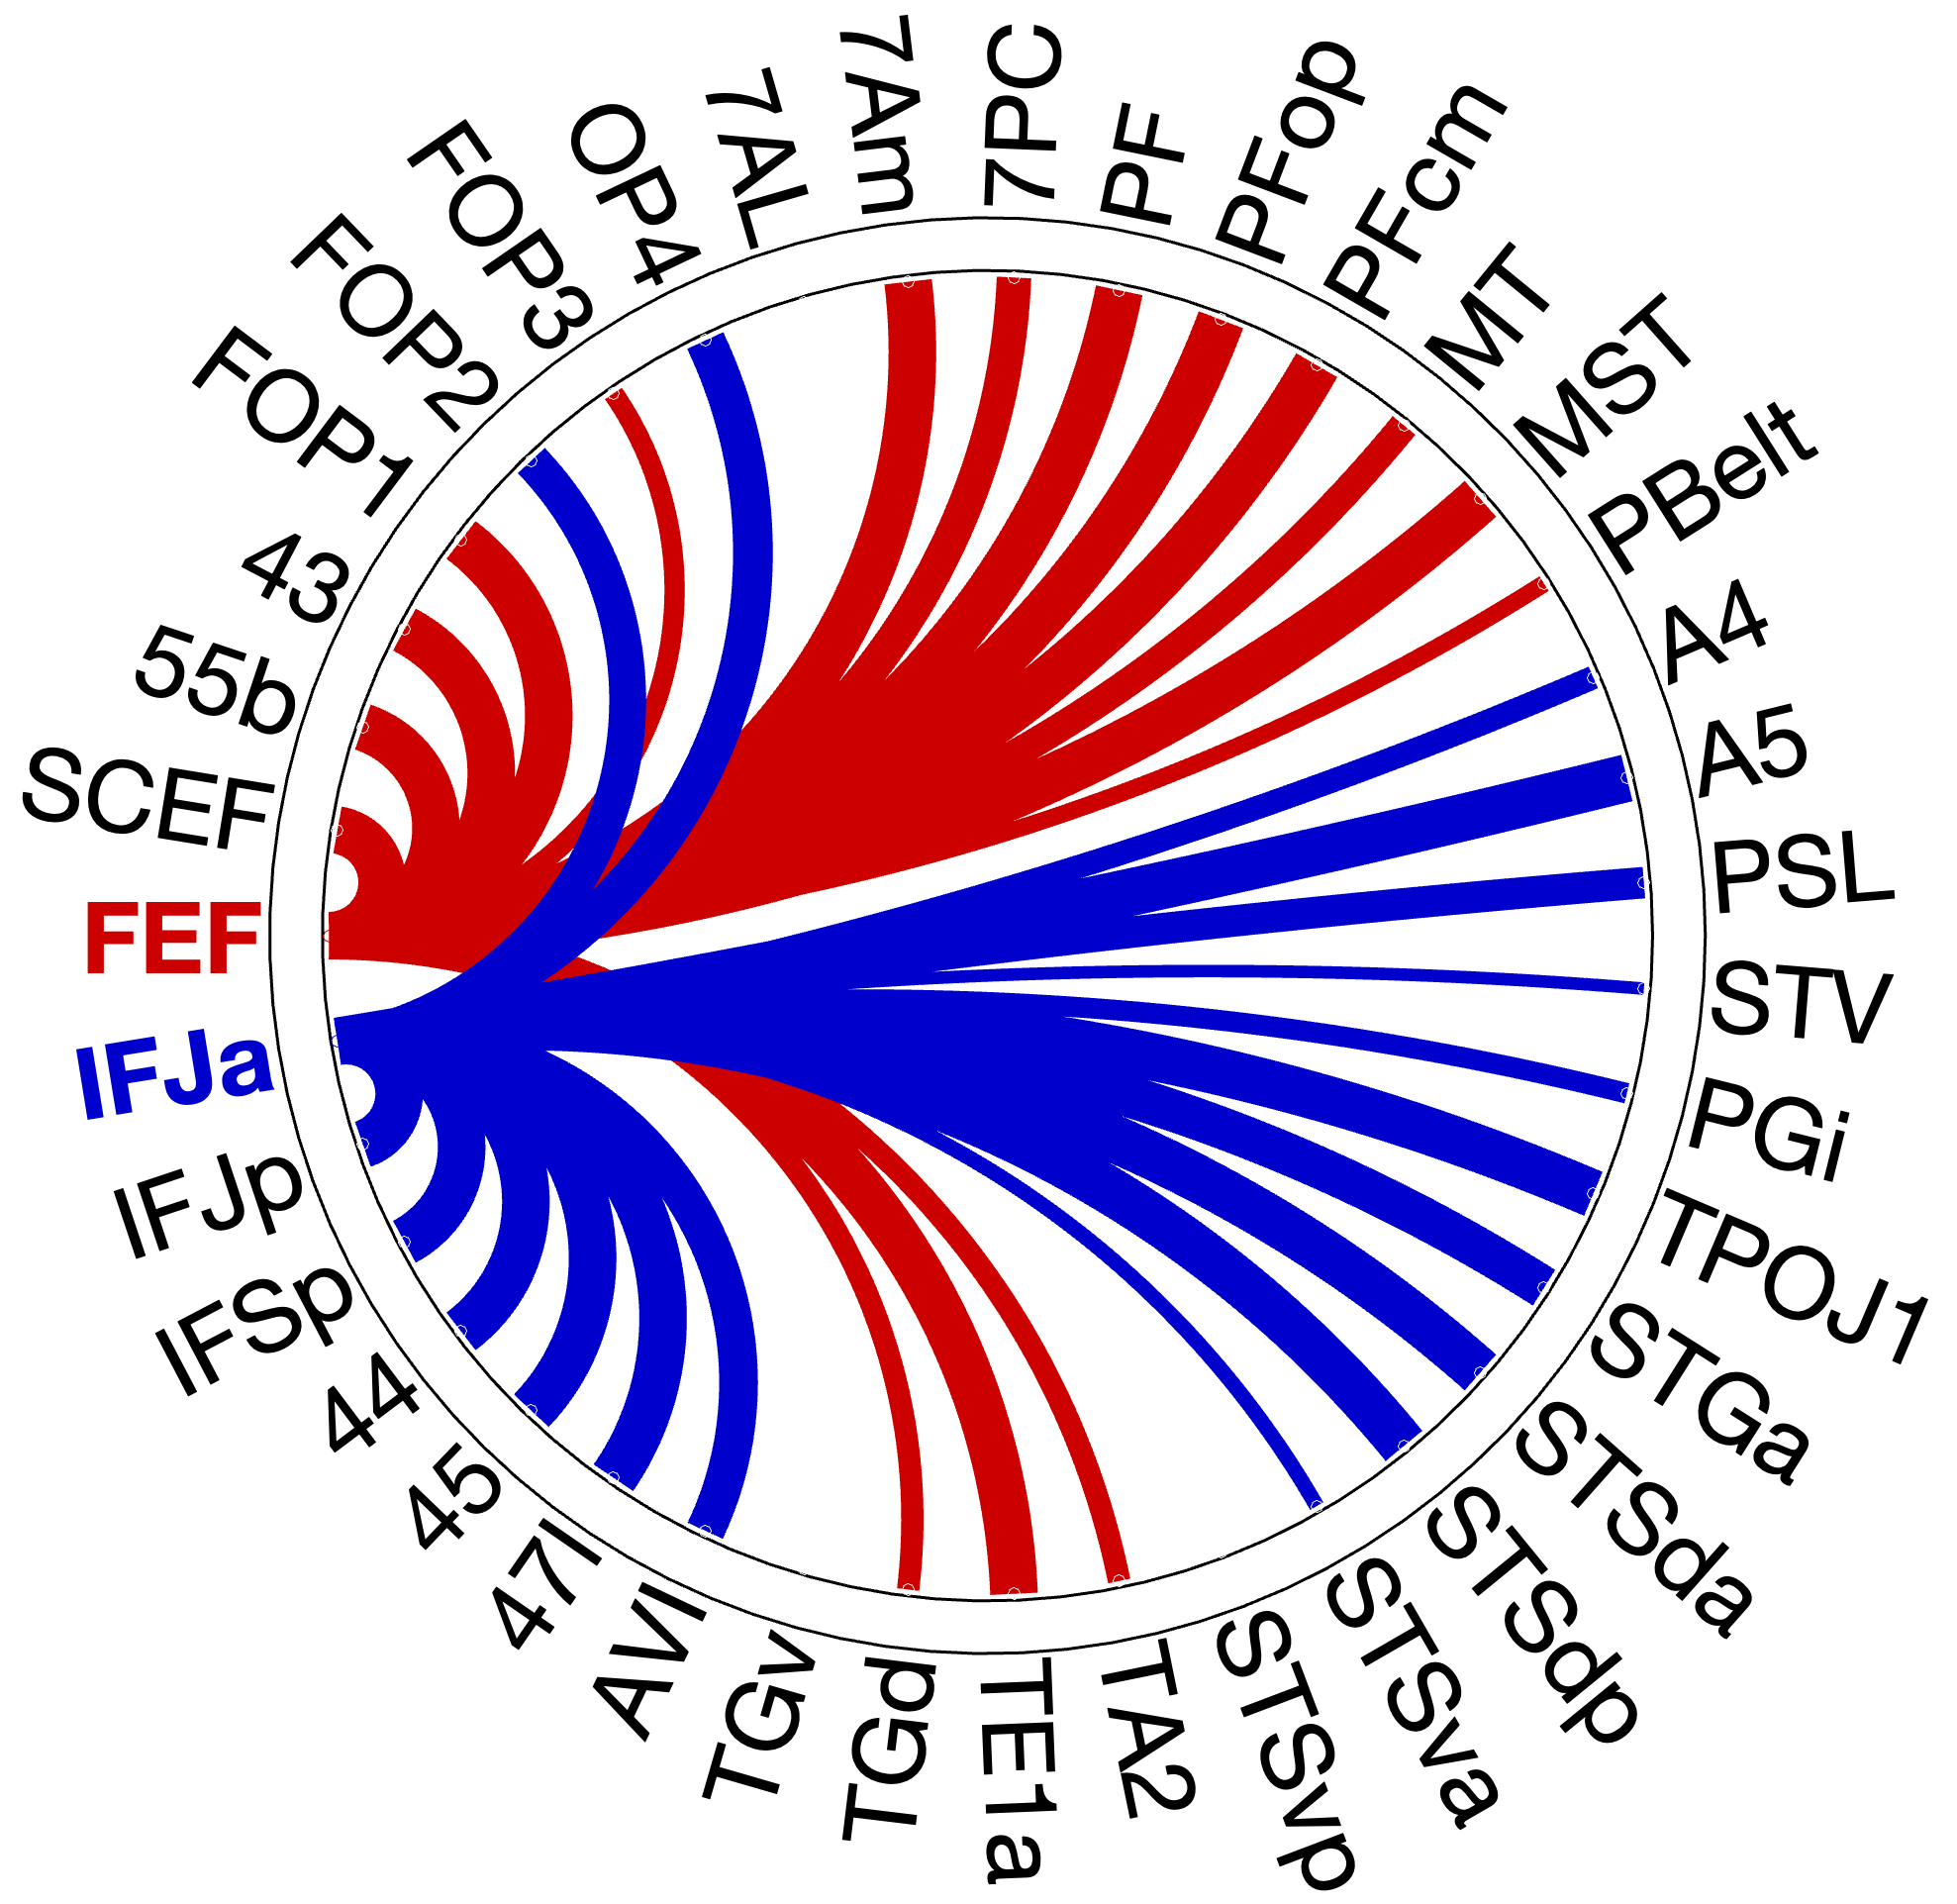
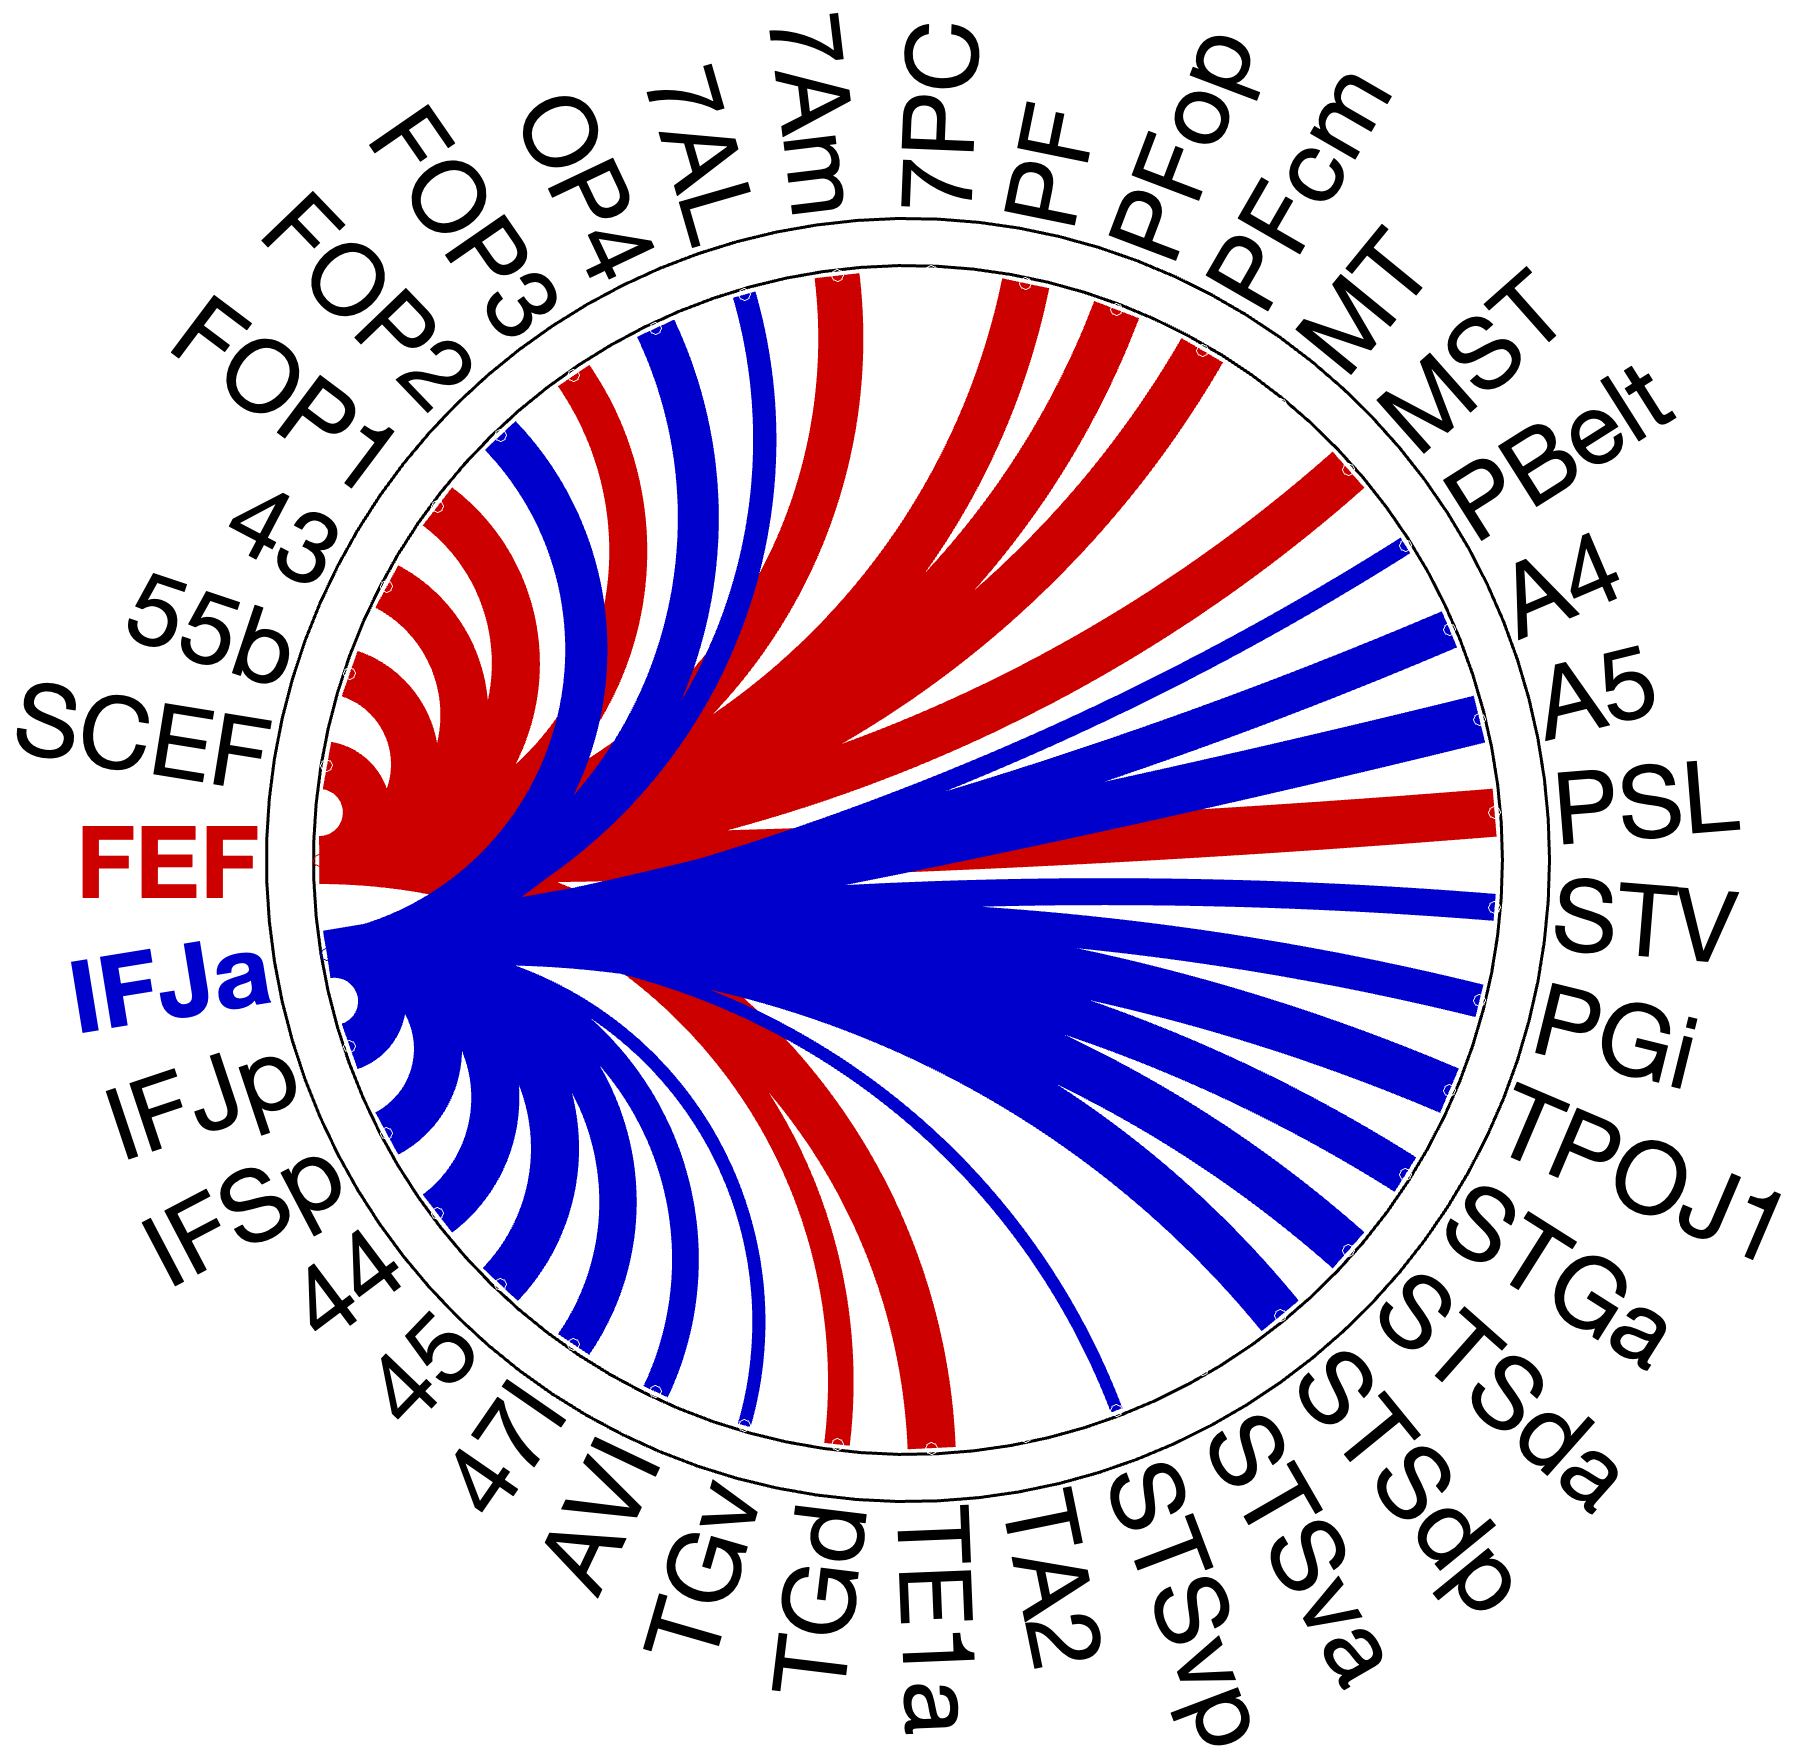
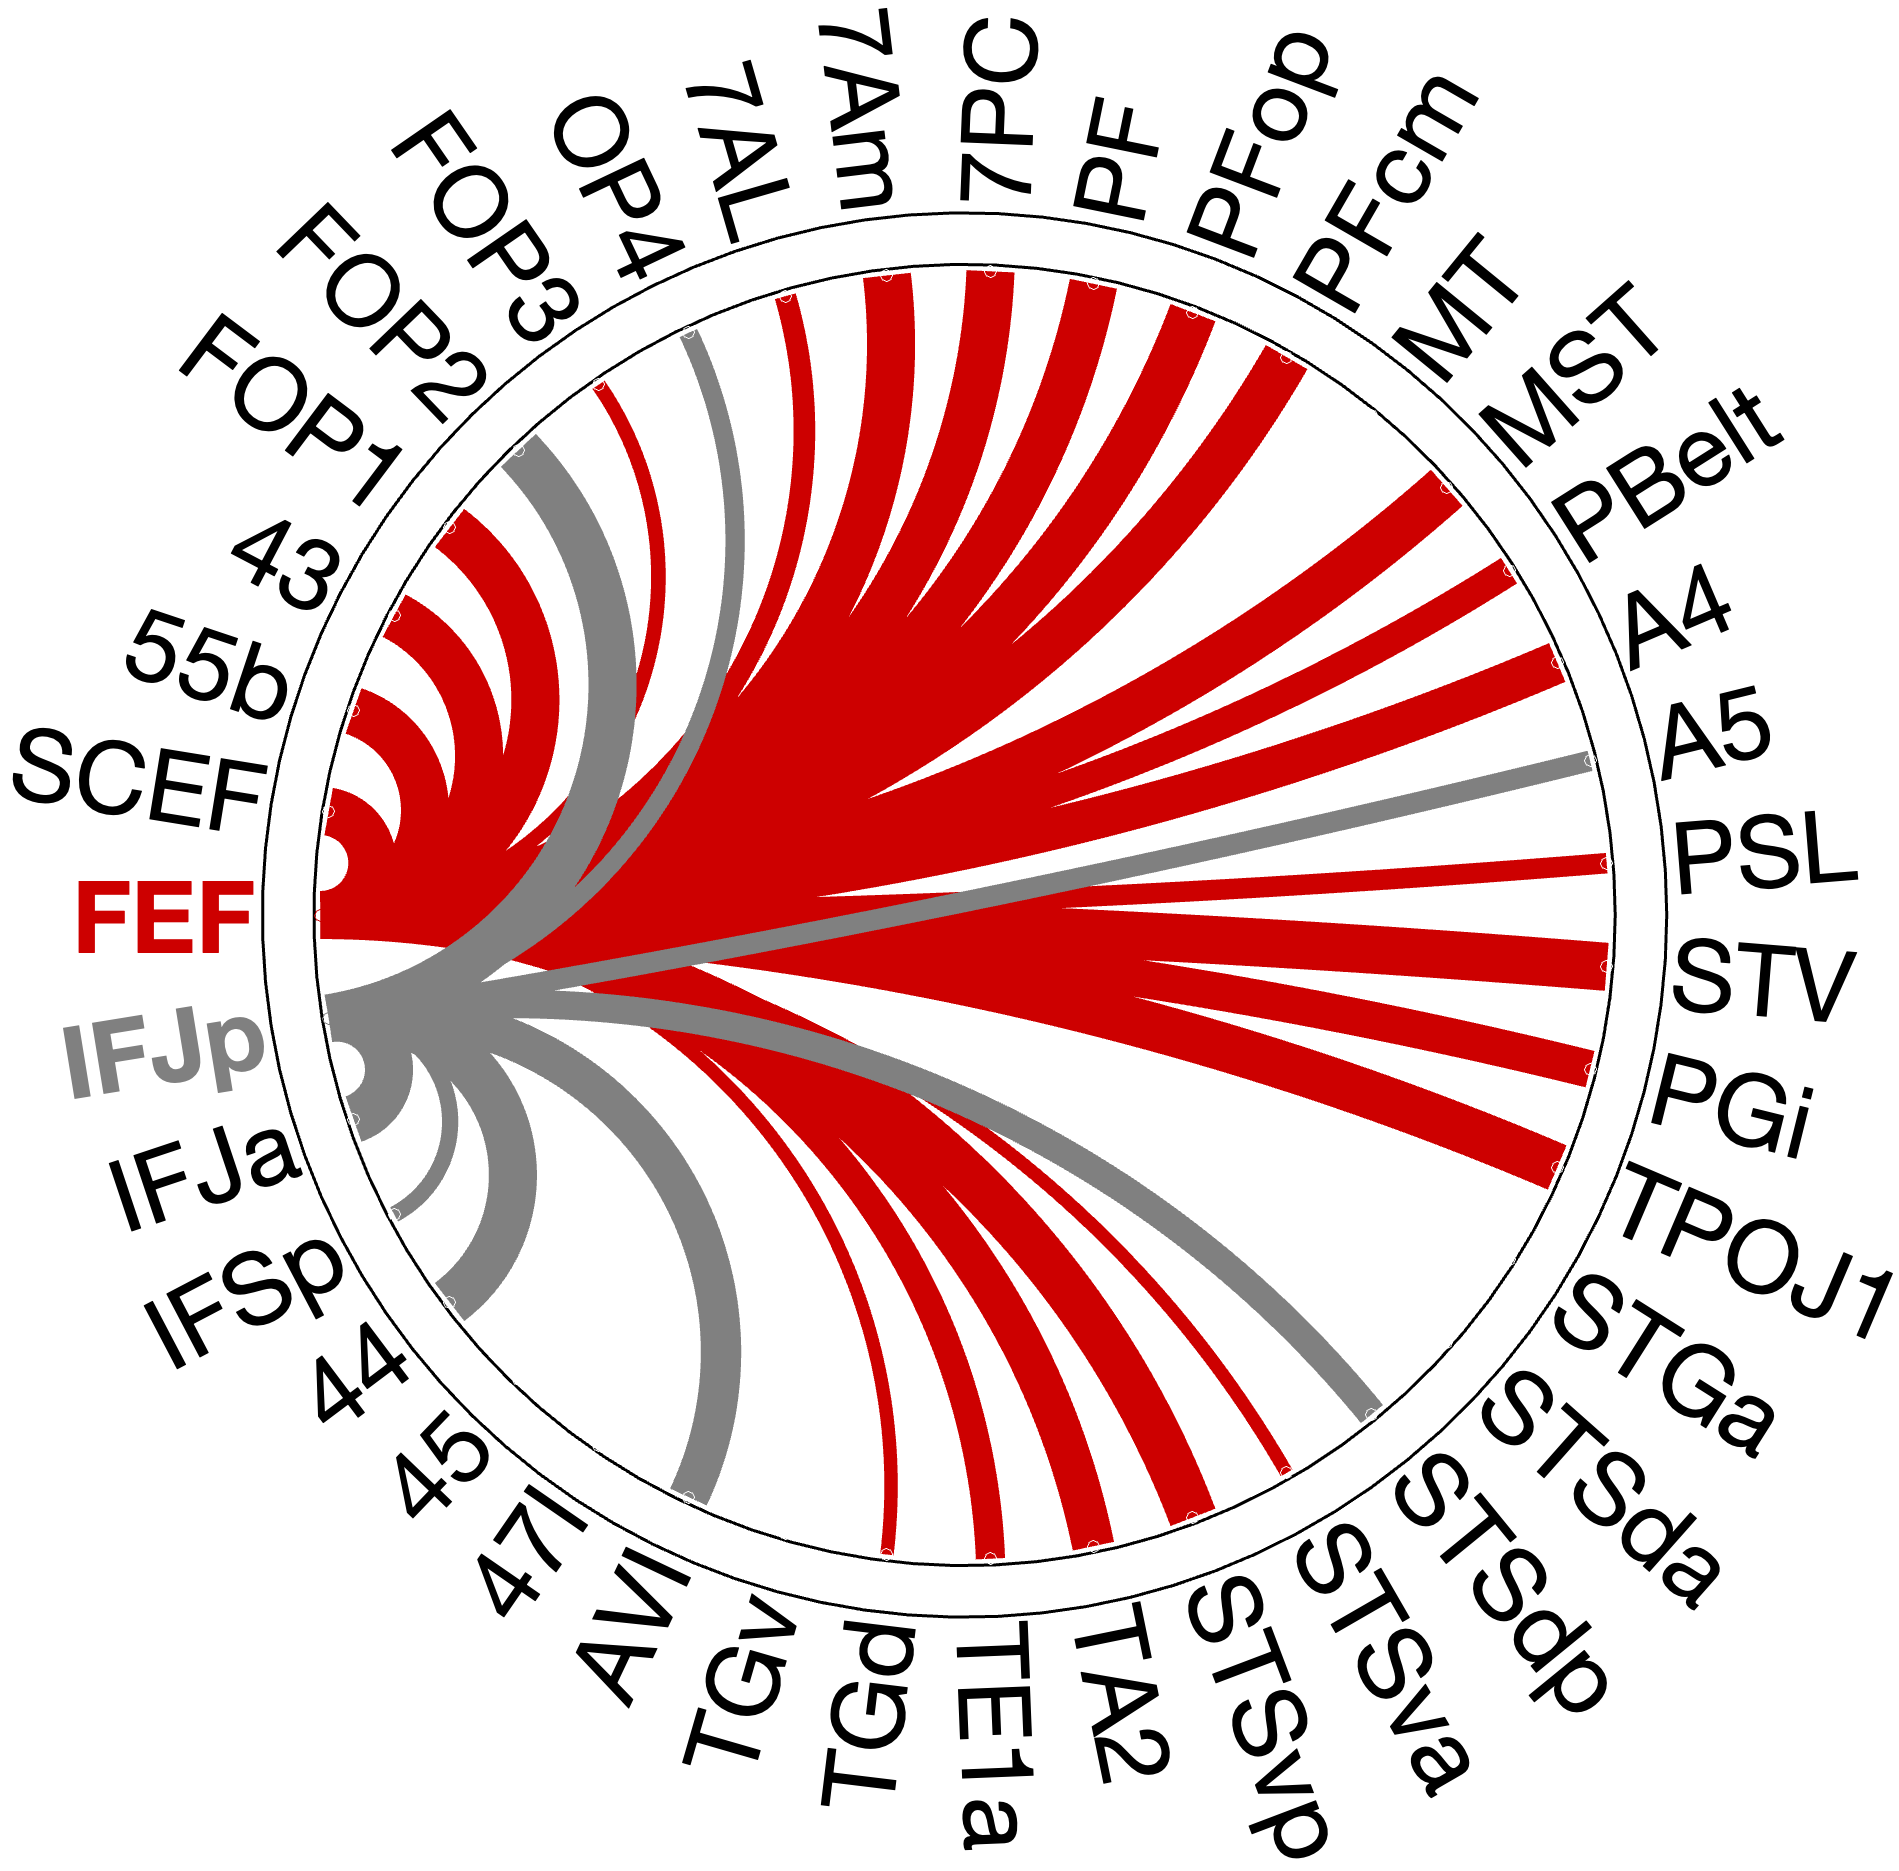
Figure 4.X: Circular connectivity diagrams comparing FEF (red) and IFJa (blue) partial correlation with all auditory target ROIs, left (A) and right (B) hemisphere. Each arc segment represents one ROI; line thickness and colour indicate the magnitude and direction of preferential coupling. Spatial-motor ROIs (inferior parietal, premotor) couple predominantly with FEF; temporal-semantic ROIs (STS, Broca areas) couple predominantly with IFJa.
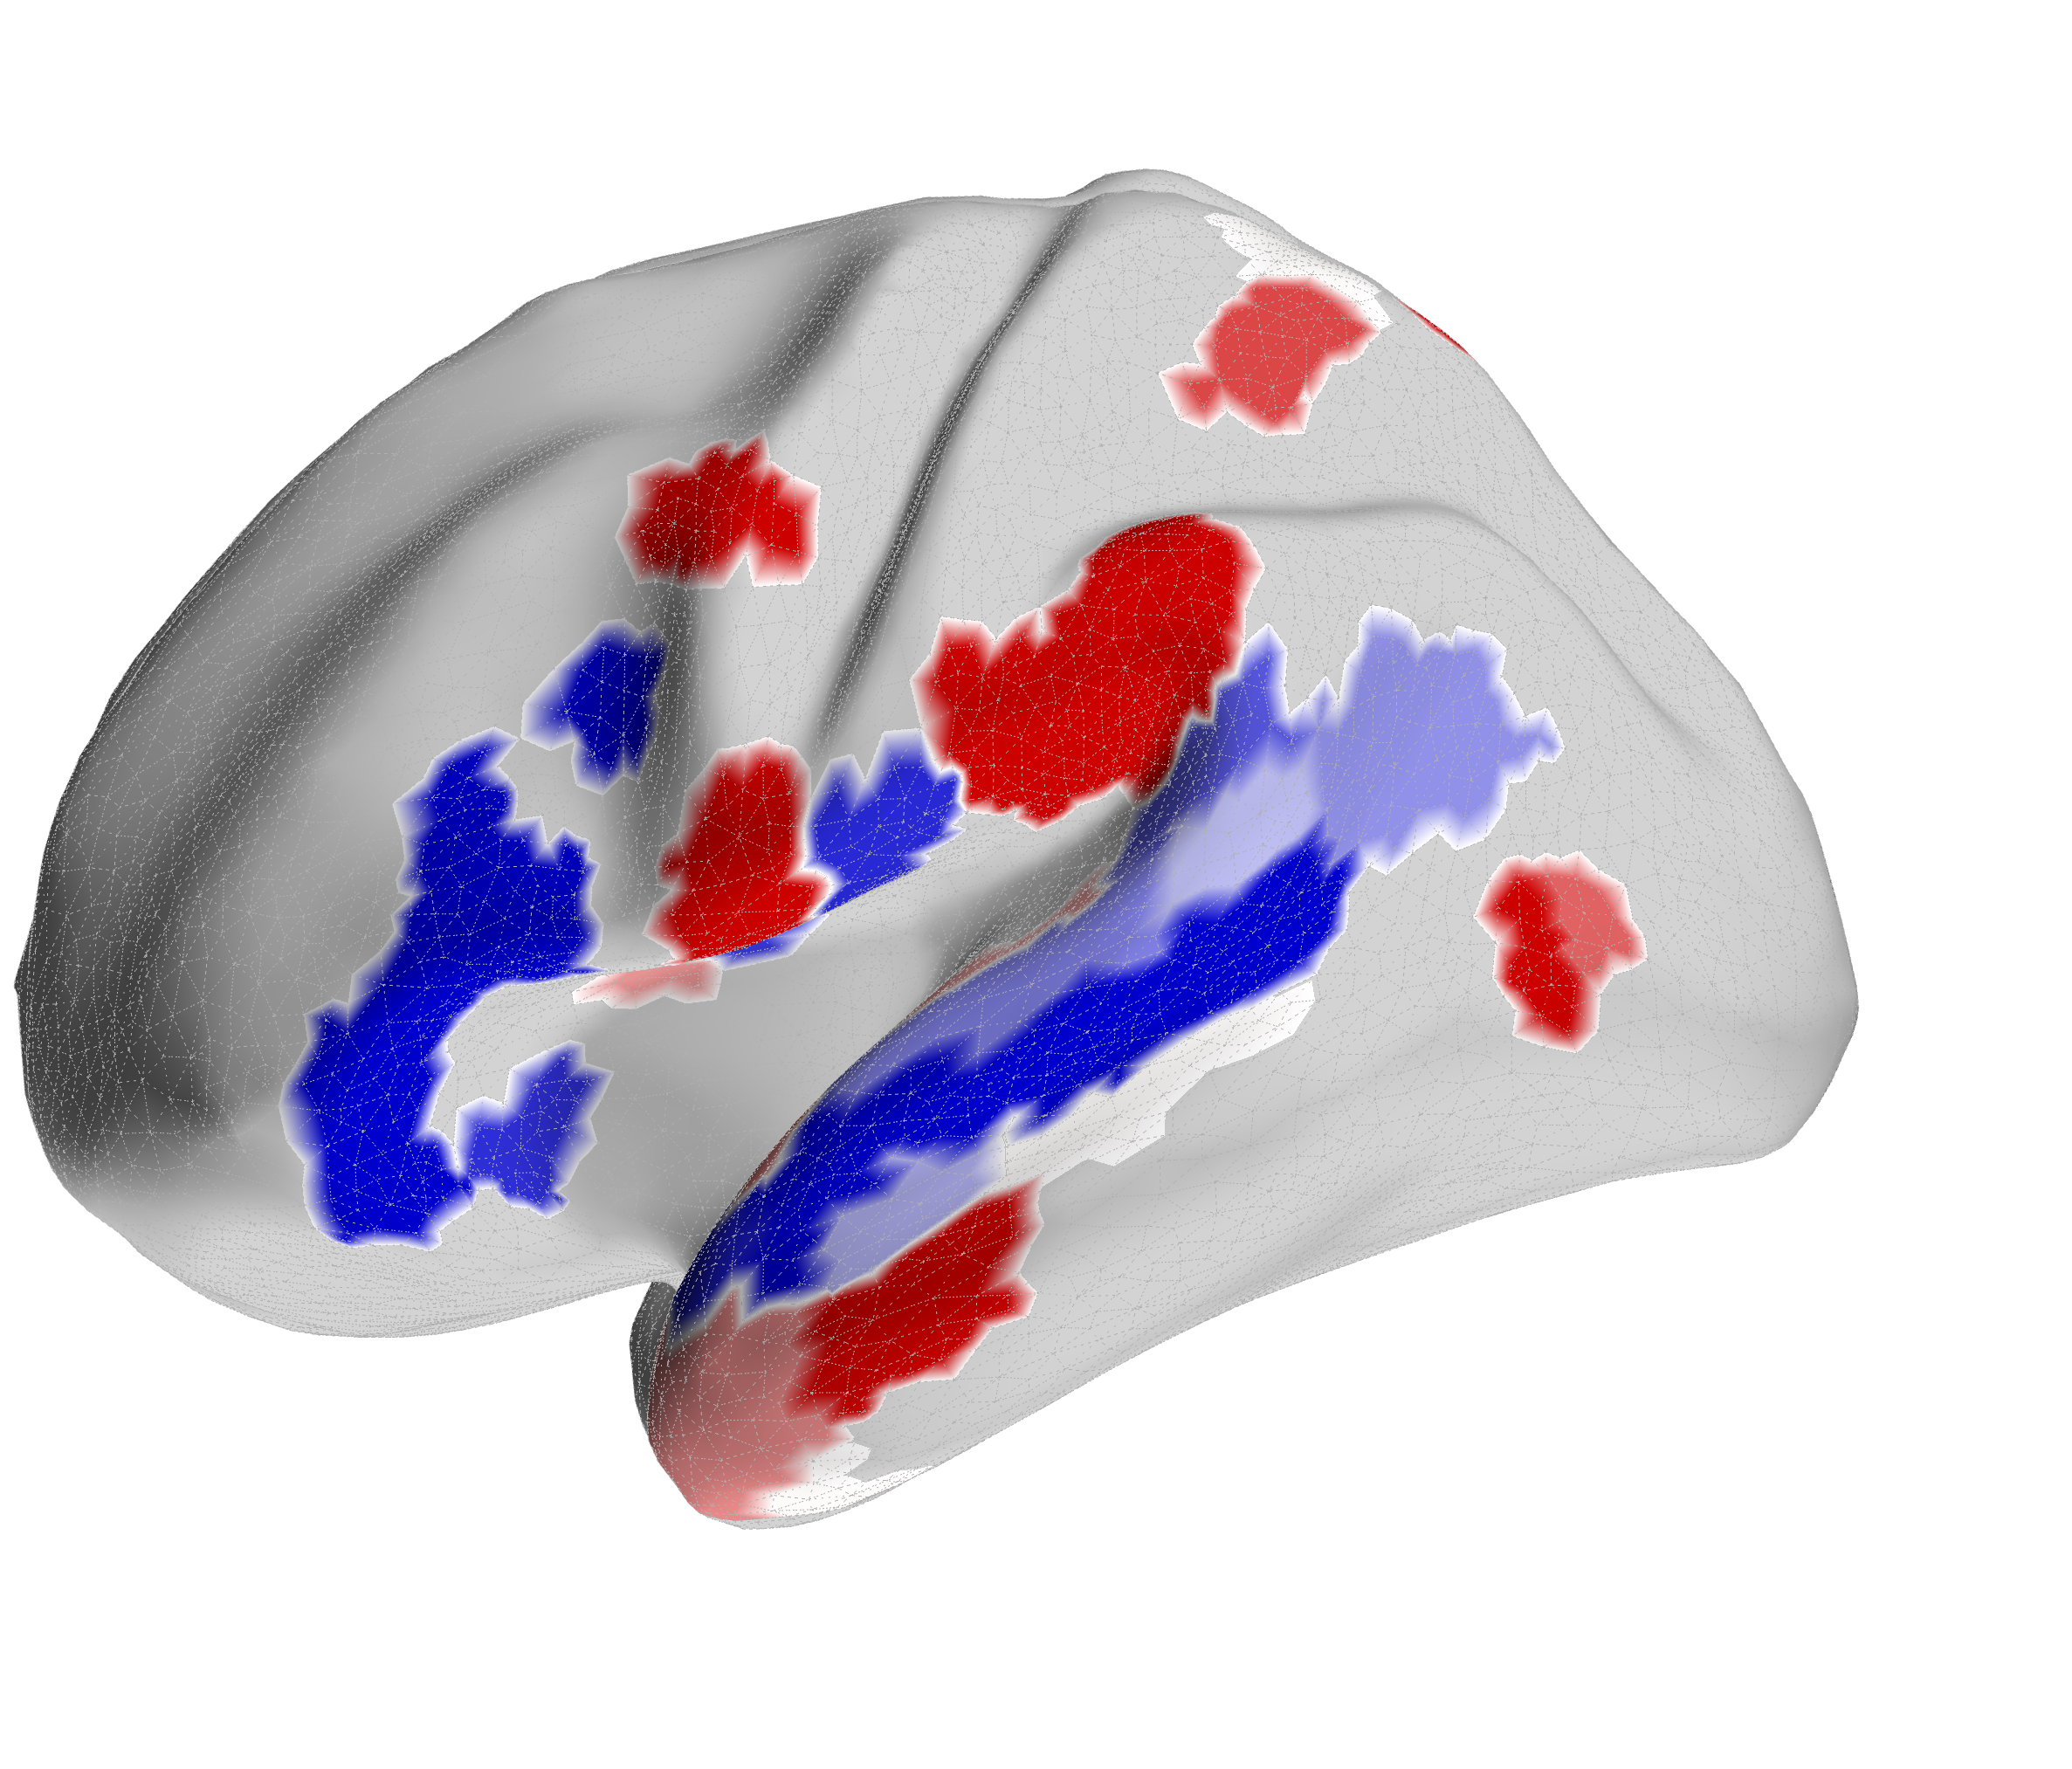
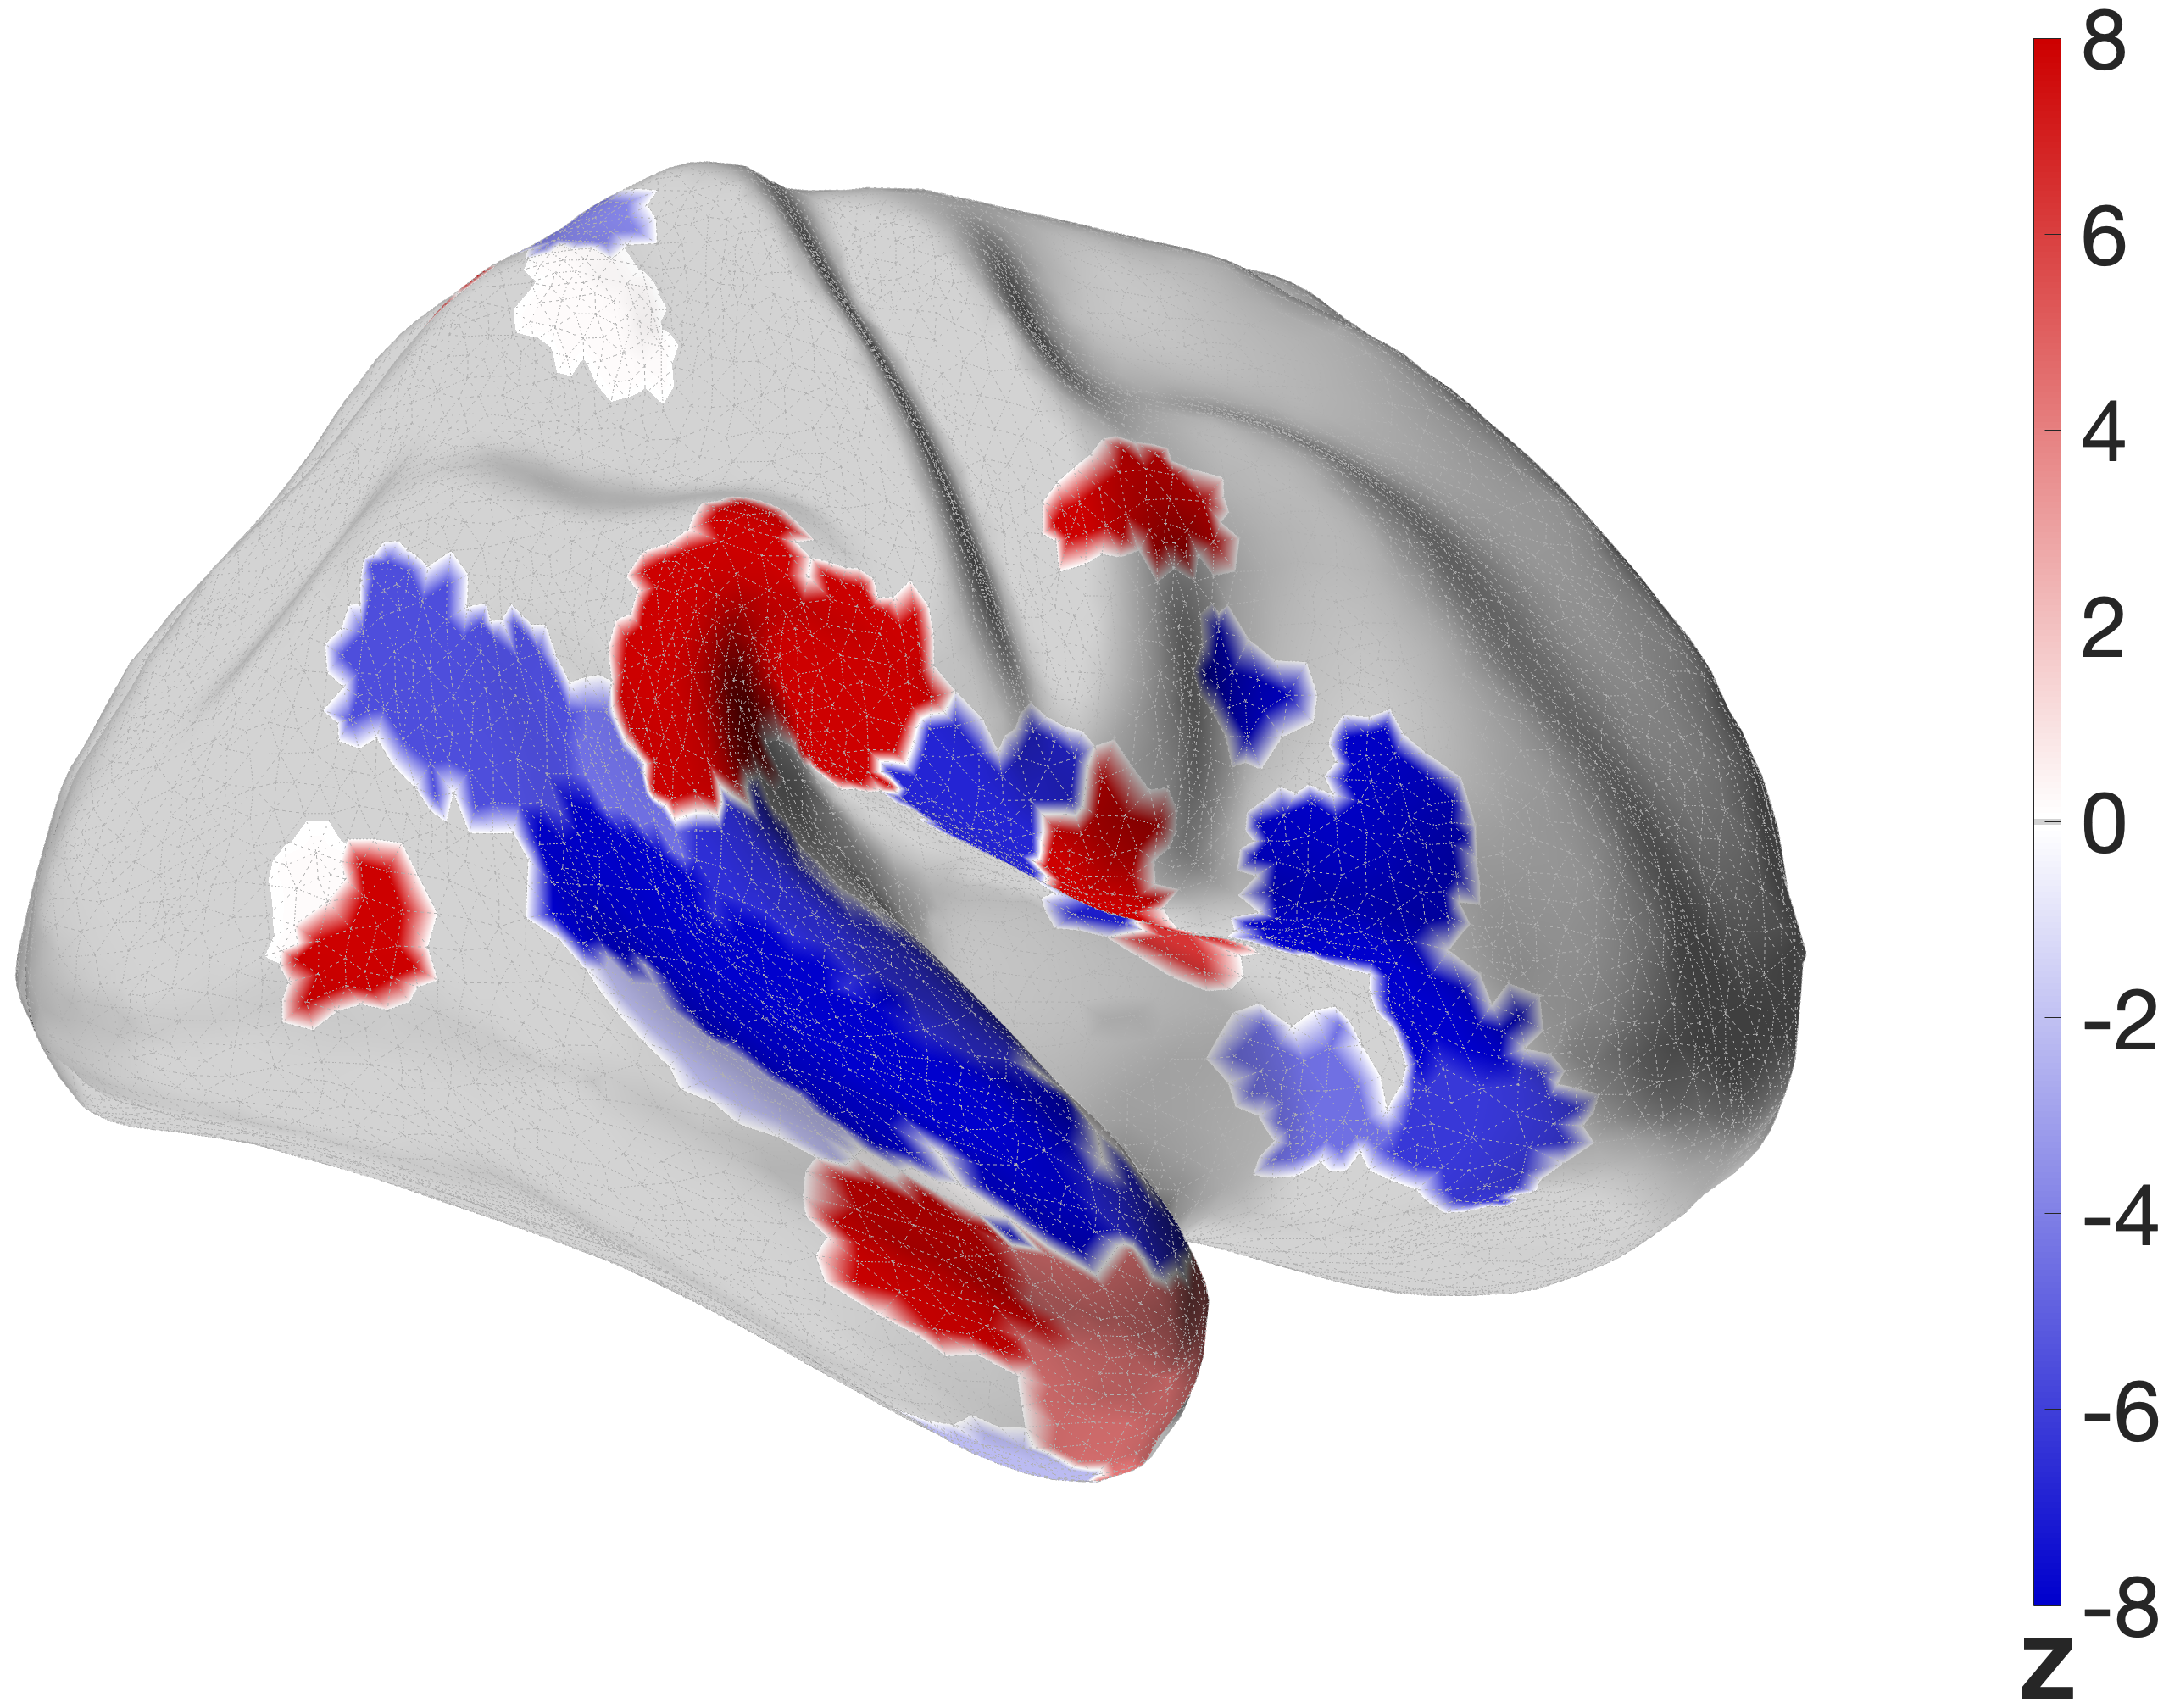
Figure 4.X: FEF versus IFJa partial correlation connectivity projected onto the cortical surface, left (A) and right (B) hemisphere. Red regions indicate preferential FEF coupling; blue regions indicate preferential IFJa coupling. The contrast between parietal and motor cortex (FEF, red) versus superior temporal sulcus and Broca’s area (IFJa, blue) visualises the double dissociation across both hemispheres.
- FEF: The FEF seed exhibits robust full correlation with the superior parietal lobe (7AL, 7Am, 7PC). This replicates the where-stream, similar to the visual stream Bedini & Baldauf (2021), together with auditory and motor regions such as A5, PBelt, FOP1, STV and PSL
- IFJa: In contrast, the IFJa showed strong coupling with the anterior language network (HCP language task)
4.1.2 Topographical Validation: IFJp Control Seed
To validate the top-down control over the auditory what-stream is driven by the anterior subdivision of IFJ, a control partial correlation model substituted IFJa for IFJp, its immediate neighbour.
The control analysis confirms the functional dissociation of where and what stream. The FEF maintains its robust connectivity to the dorsal auditory and motor network with 23 significant regions in the left and 20 in the right hemisphere.
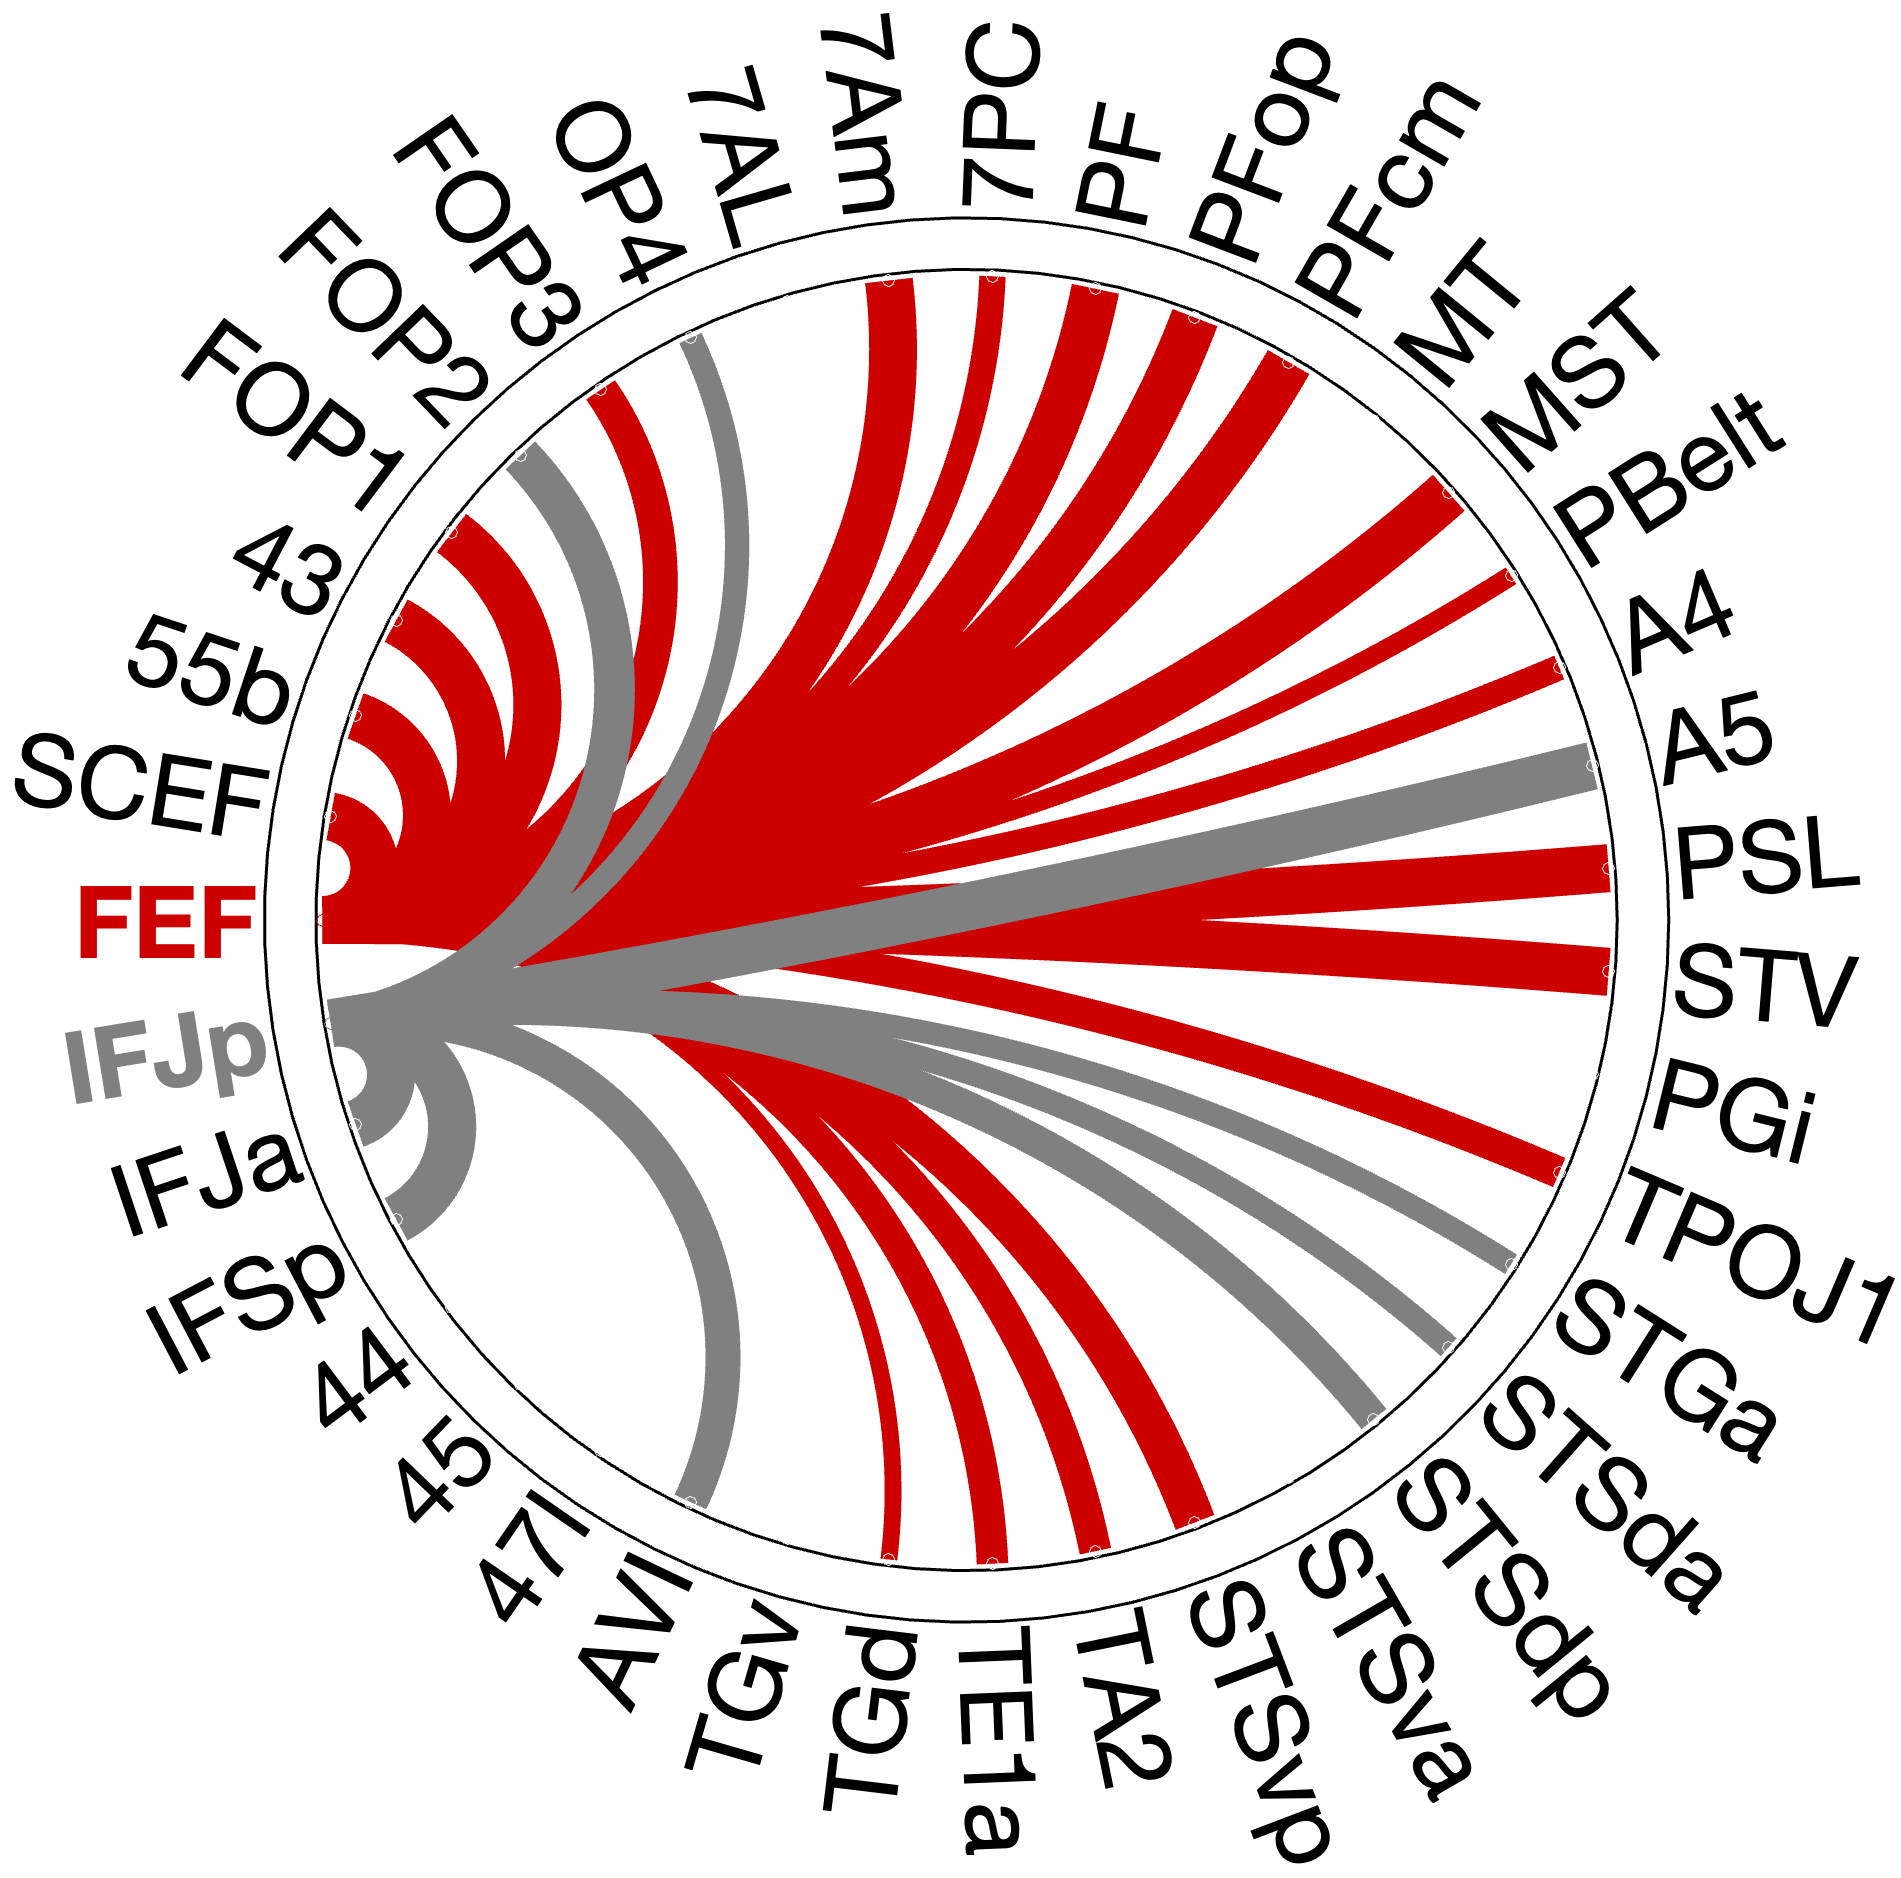
Figure 4.X: Specificity control: FEF (red) versus IFJp (grey) partial correlation circular diagrams, left (A) and right (B) hemisphere. Substituting IFJa with its immediate posterior neighbour IFJp substantially reduces temporal coupling, confirming that top-down control over the auditory ‘what’-stream is specific to the anterior IFJ subdivision and does not generalise to adjacent prefrontal regions.In the profound contrast substituting the what-hub with IFJp leads to a significant drop in the connectivity pattern of the semantic what-stream. The IFJp fails to communicate with the temporal lobe in comparison to the FEF.
Link zum Original
This contrast provides the evidence that the prefrontal control hub over auditory identity processing is functionally exclusively anchored in the IFJa.
Transclude of 4.2-Testing-the-"Where"-Stream-(FEF-Connectivity)#42-testing-the-where-stream-fef-connectivity
Transclude of 4.3-Testing-the-"What"-Stream-(IFJa-Connectivity)#43-testing-the-what-stream-ifja-connectivity
4.4 Resolving Ambiguities
During the analysis and literature review, areas A4, A5, PBelt, PSL and STV demonstrated an ambiguous connectivity pattern. This chapter will dissolve ambiguities found in the literature and results of the RSFC analysis.
A4 and A5. We placed areas A4 in the ‘where’-stream and A5 in the ‘what’-stream (Section 3.2.5), given the conflicting evidence in the literature (Rolls et al. (2023) - Cerebral Cortex, Glasser et al. (2016) - Nature). Partial correlation analysis resolves this conflict empirically by showing robust and bilateral connectivity of both areas A4 and A5 with IFJa (A4: left , ; right , ; A5: left , ; right , ), while showing no meaningful coupling with FEF. The only exception is a weak, left-lateralized A4-FEF connection (, ) in the single seed analysis with FEF. This pattern positions both A4 and A5 as ‘what’-stream gateways under potential IFJa top-down control.
PBelt. PBelt was grouped alongside A4 as a potential dorsal gateway in the pre-analysis classification (Section 3.2.5). In the single-seed IFJa analysis, PBelt shows only weak coupling (right: , ). Partial correlation reduces this further to near-equivalent values for both prefrontal seeds (IFJa: right , ; FEF: left , ). The absence of a dominant prefrontal partner, combined with near-zero mean connectivity, indicates that PBelt’s functional coupling is insufficient for reliable stream assignment.
PSL. Rolls et al. (2023) - Cerebral Cortex classify PSL within the ventral semantic network, while Dureux (2024) reports complete acoustic unresponsiveness across all stimulus categories. Our analysis reveals a strongly asymmetric connectivity profile. The IFJa single-seed analysis shows bilateral PSL-IFJa coupling (left , right , ). The FEF single-seed analysis reveals a right-lateralized PSL-FEF connection (, ), entirely absent in the left hemisphere. No other ROI in this analysis displays this pattern of bilateral ‘what’-stream coupling alongside exclusive right-lateralized ‘where’-stream coupling.
STV. STV was classified as part of the ventral language network by Rolls et al. (2023) - Cerebral Cortex and couples directly with both prefrontal seeds in separate single-seed analyses. In full correlation, STV couples with FEF stronger in both hempsheres, but when it comes to partial correlation, IFJa wins in both. In the IFJa analysis, STV couples bilaterally with IFJa (left , ; right , ), after partialling out FEF. In the FEF analysis, STV couples bilaterally with FEF (left , ; right , ), after partialling out IFJa. In both cases, the coupling is direct, not mediated through indirect connections.
Link zum Original
4.5 Functional Roles of Adjacent Areas
4.5.3 Specificity Validation: FEF vs. 55b
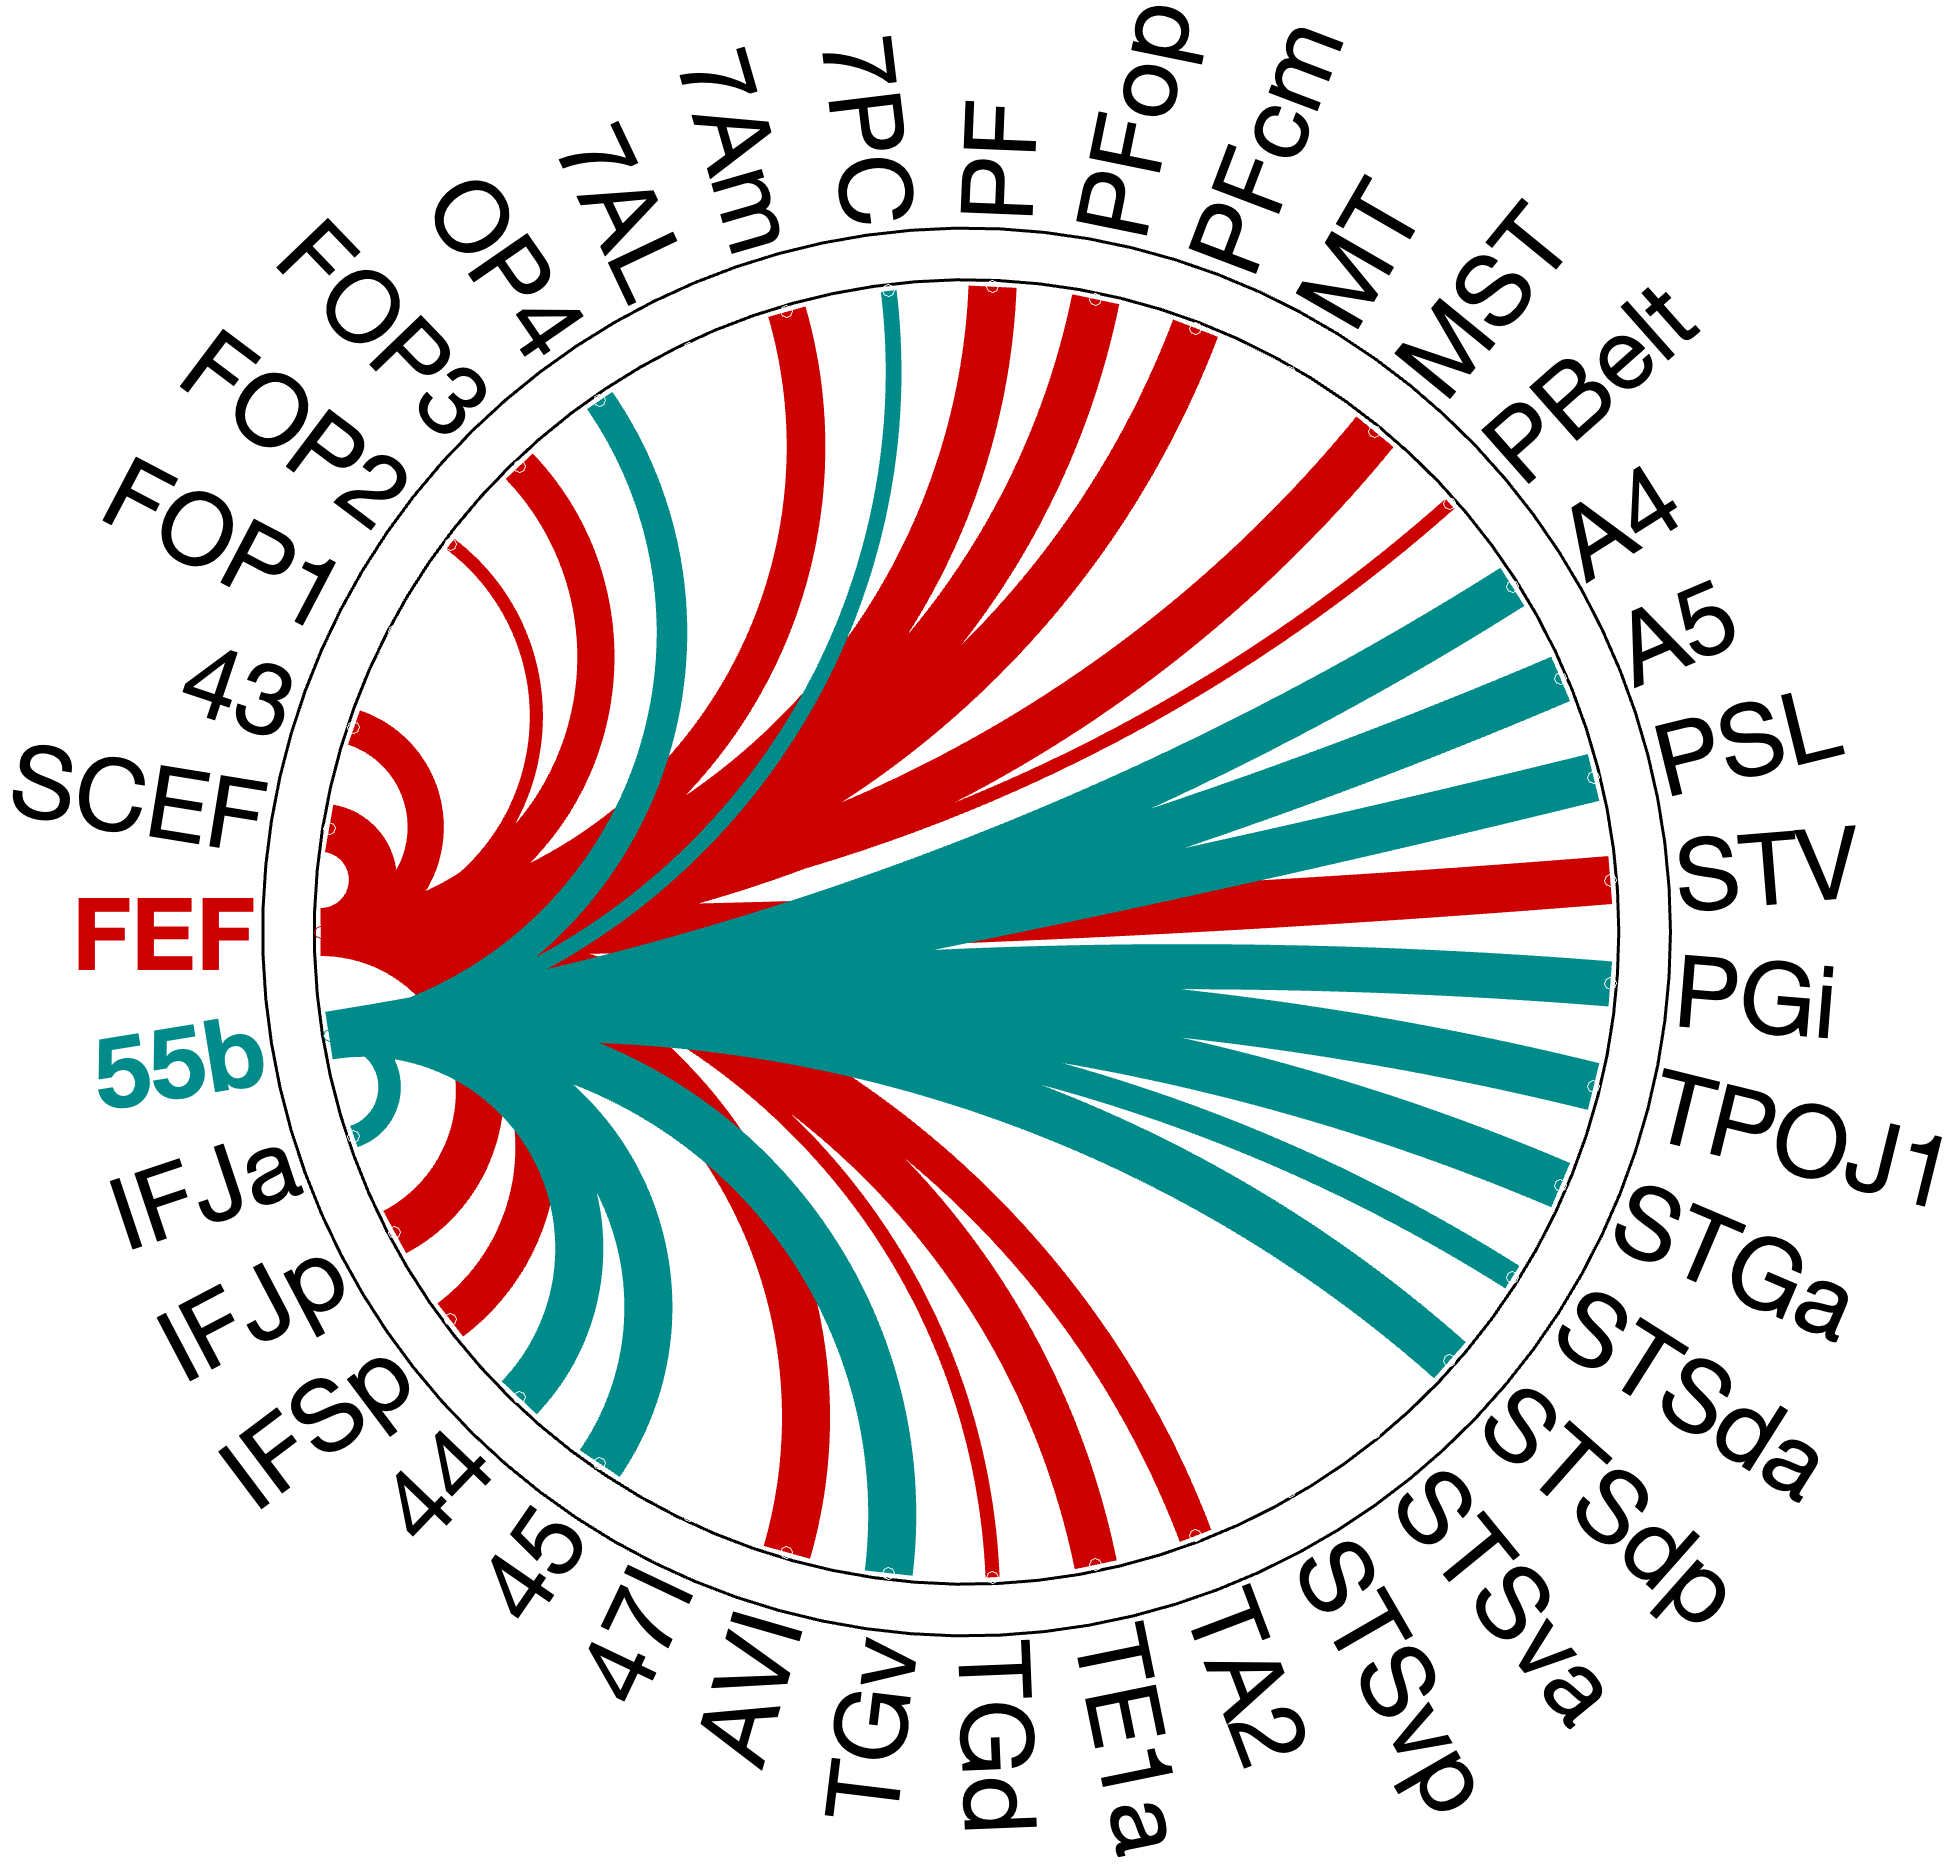
A parallel validation compared FEF with its immediate premotor neighbour, area 55b, using partial correlation to rule out nonspecific regional signals. Despite their direct anatomical neighbourhood, the two seed regions exhibit clearly dissociable connectivity patterns. In both hemispheres, the FEF maintains dominant coupling with parietal and motor areas (PF: left , ; right , ; PFcm: left , ; MST: left , ). In contrast, area 55b dominates language-related connectivity, with the highest mean connectivity values in the entire analysis: PSL (left , ; right , ), STSdp (left , ; right , ), and Broca’s areas 44 (left , ; right , ) and 45 (left , ; right , ). The FEF profile shows no equivalent coupling with temporal or language regions in either hemisphere.
Figure 4.X: Functional connectivity heatmap comparing FEF and area 55b partial corre- lation z-scores across all auditory target ROIs. Despite anatomical adjacency, FEF (upper rows) couples preferentially with parietal and motor regions, while 55b (lower rows) couples predominantly with temporal, opercular, and language areas. This dissociation confirms that the spatial connectivity profile is specific to the FEF and does not reflect a general dorso-prefrontal signal.
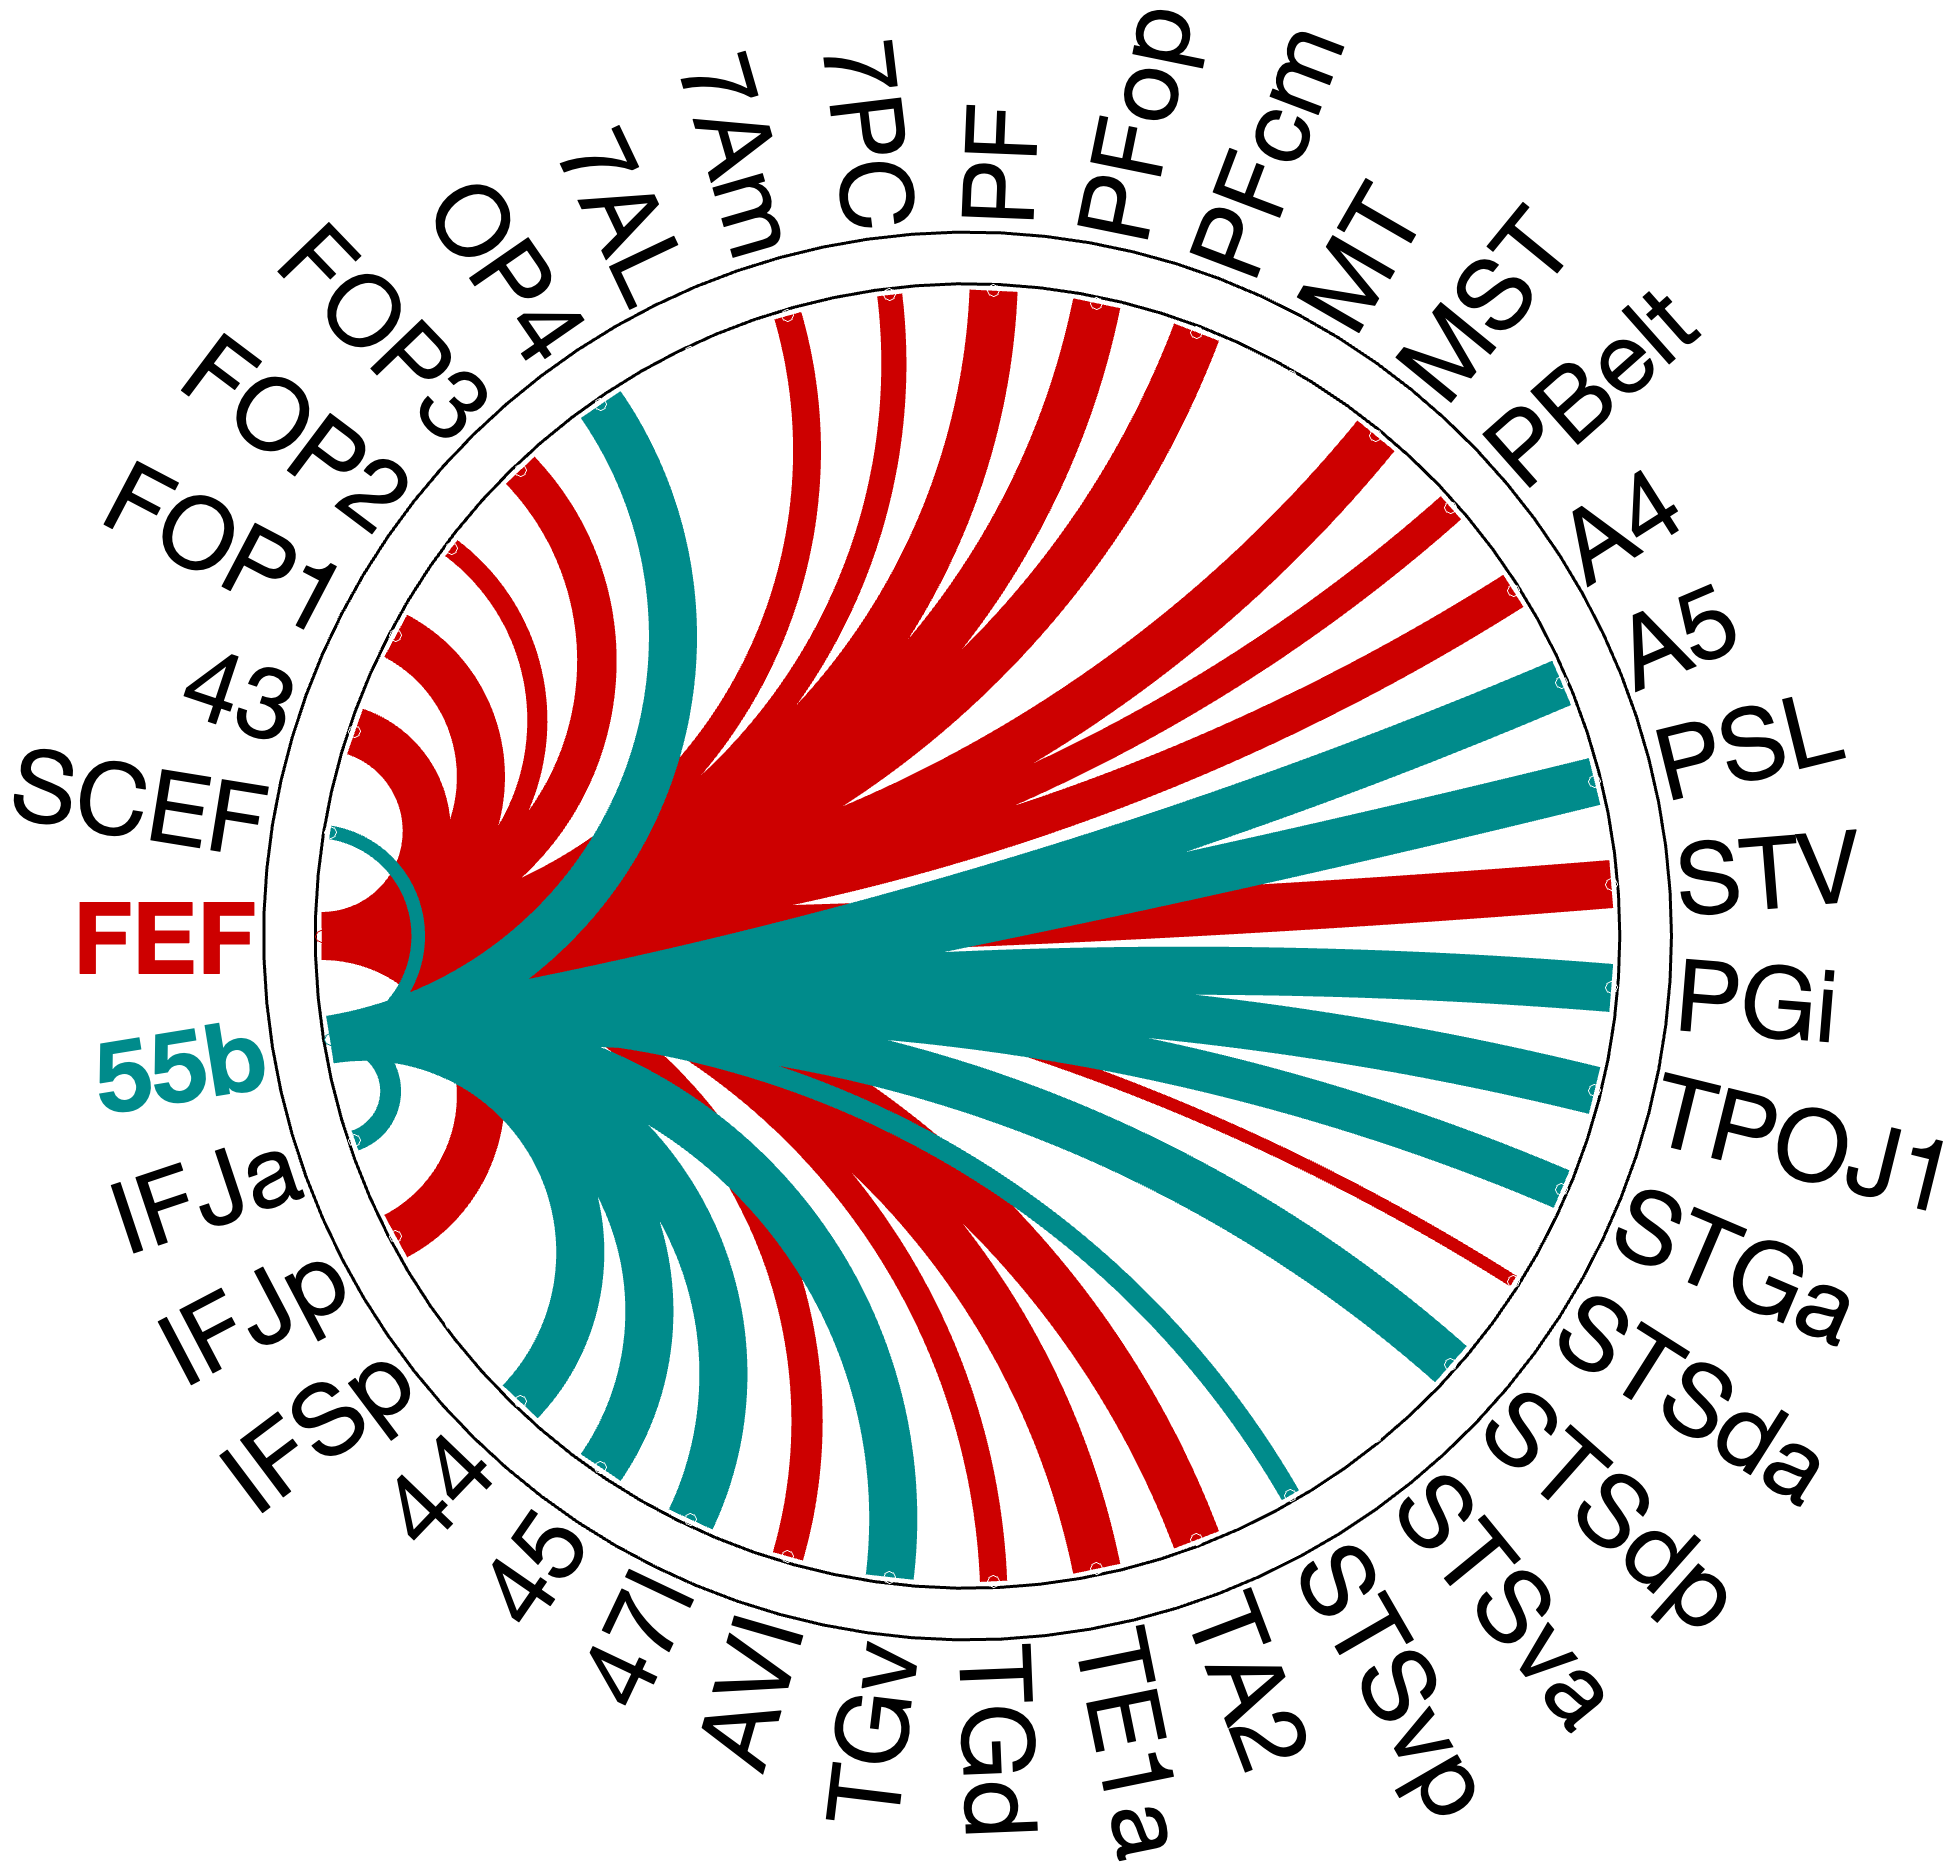
Figure 4.X: FEF versus 55b partial correlation circular diagrams, left (A) and right (B) hemisphere. Area 55b (green) exhibits dominant connectivity to superior temporal regions, Broca’s complex (Area 44, Area 45), and early auditory areas (A4, A5), while FEF (red) emphasises inferior parietal and premotor areas. The opposing profiles confirm that 55b functions as a language relay rather than a spatial control hub.
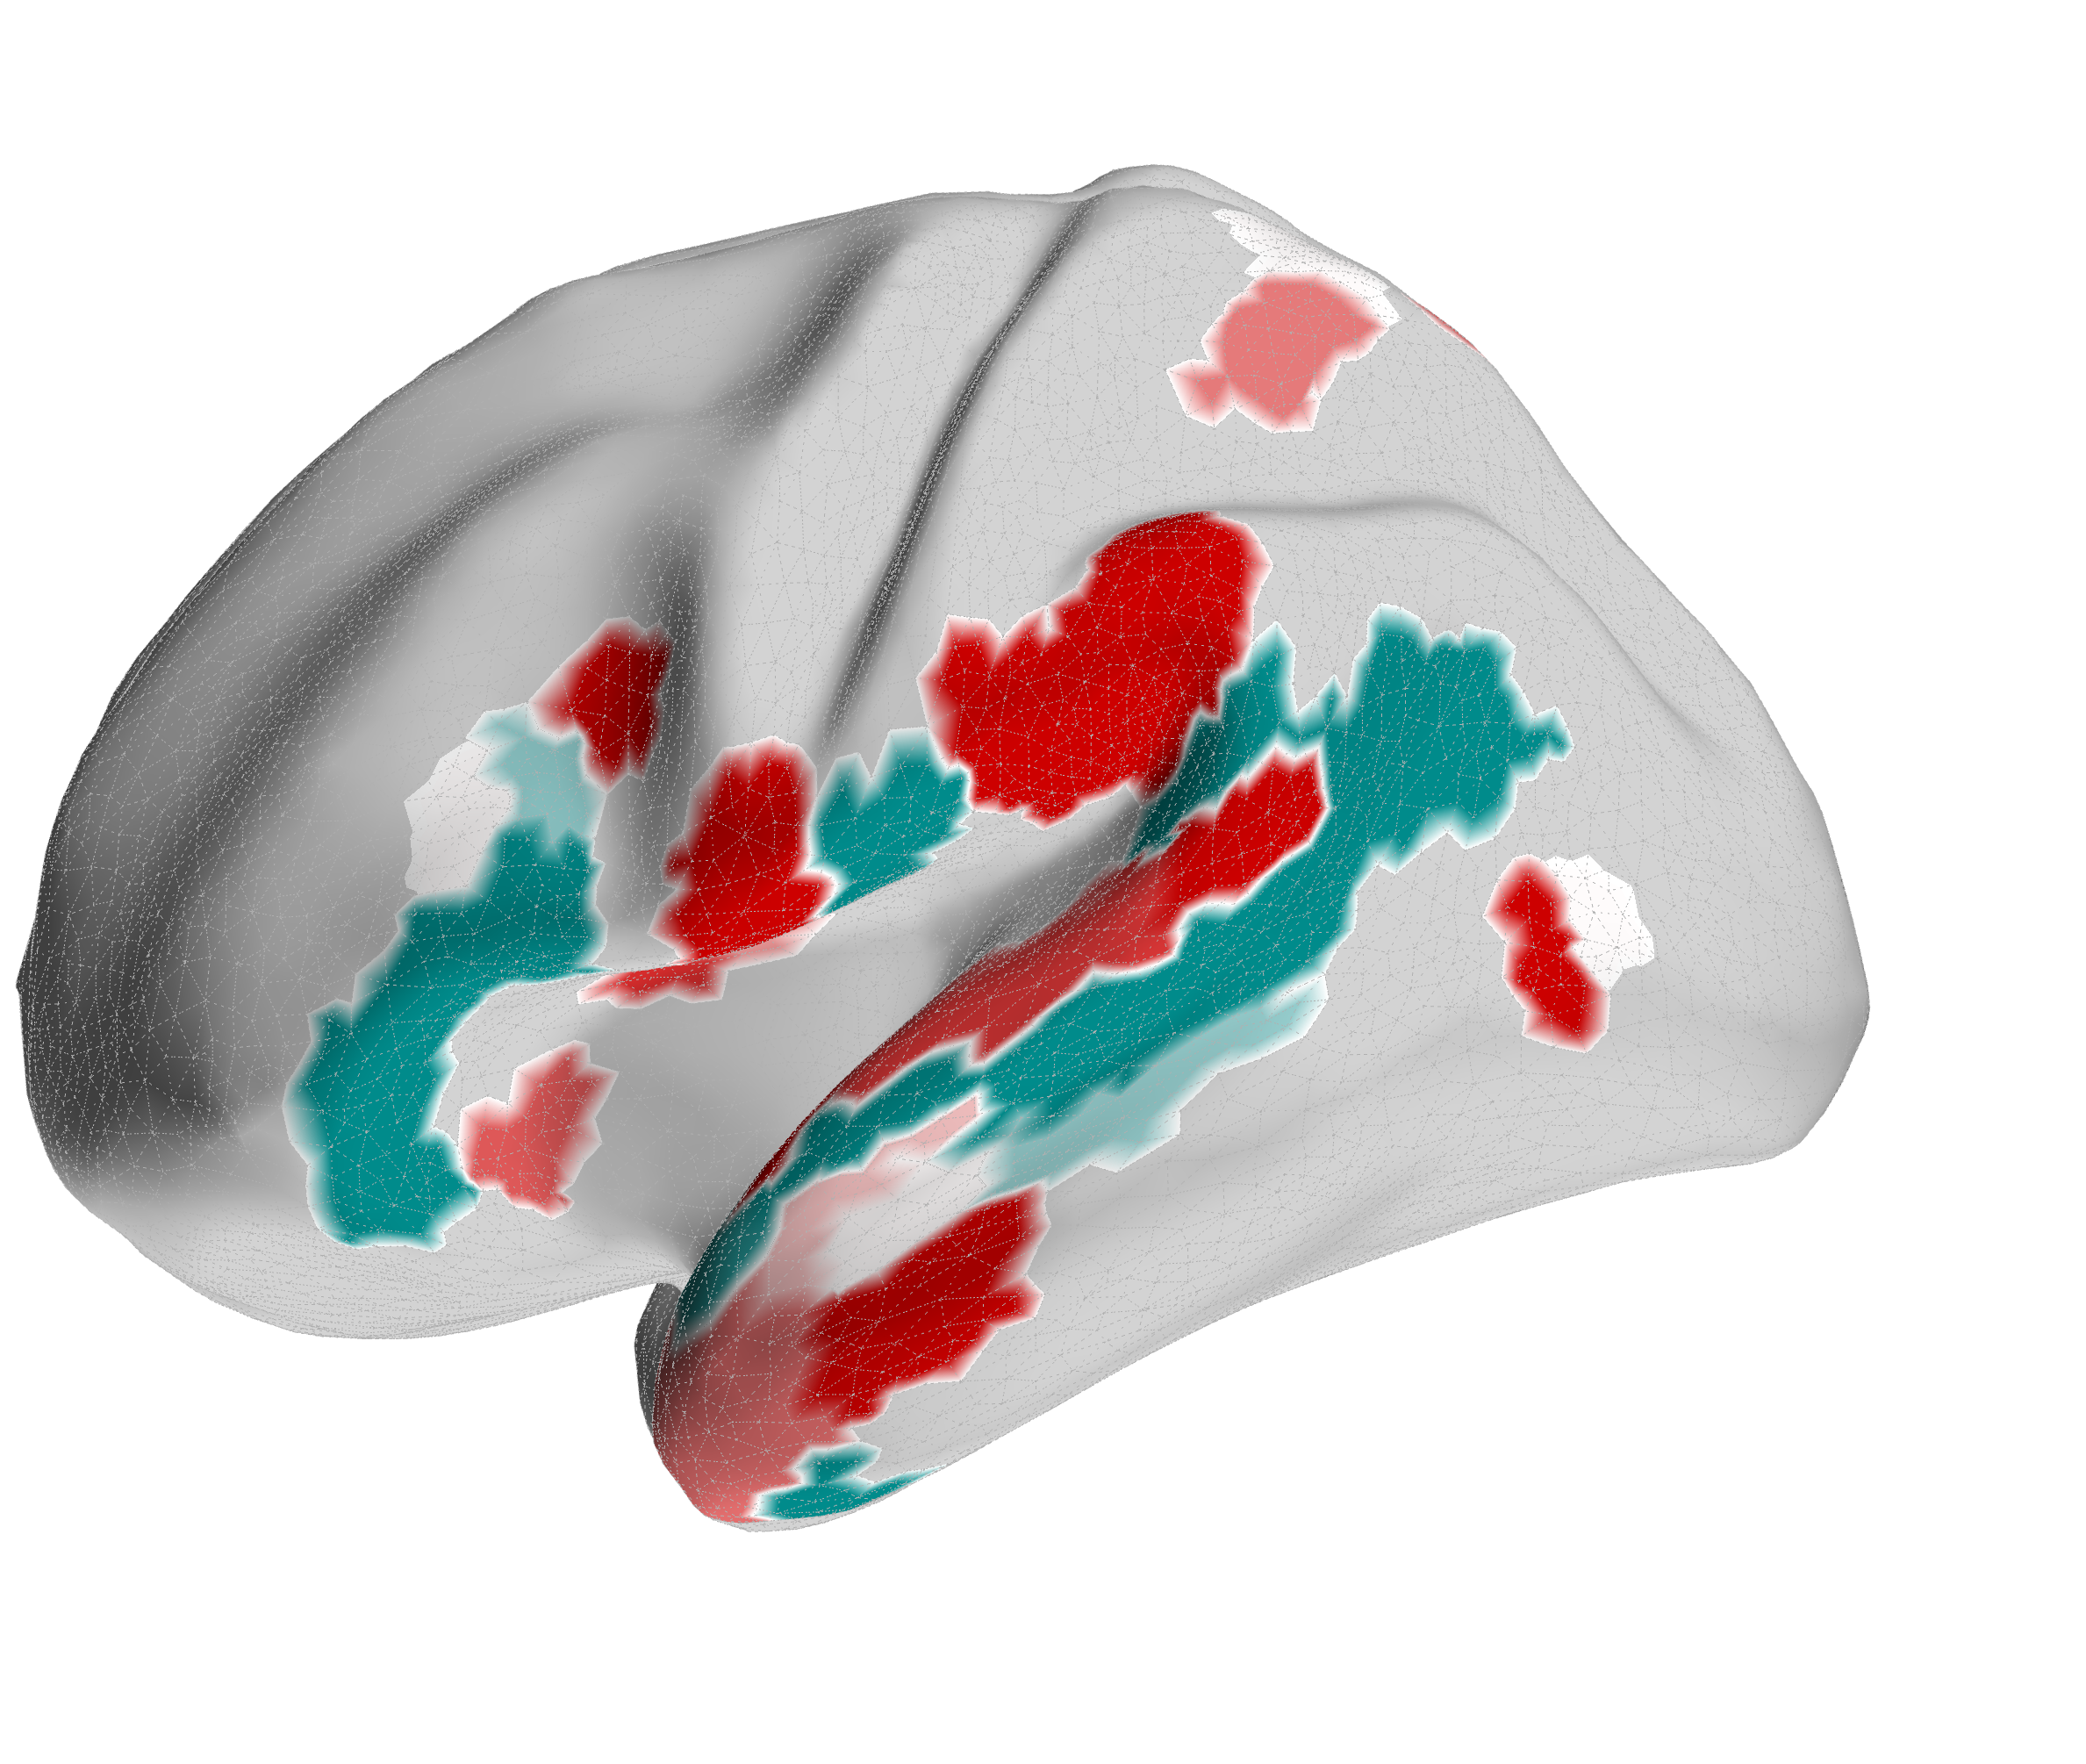
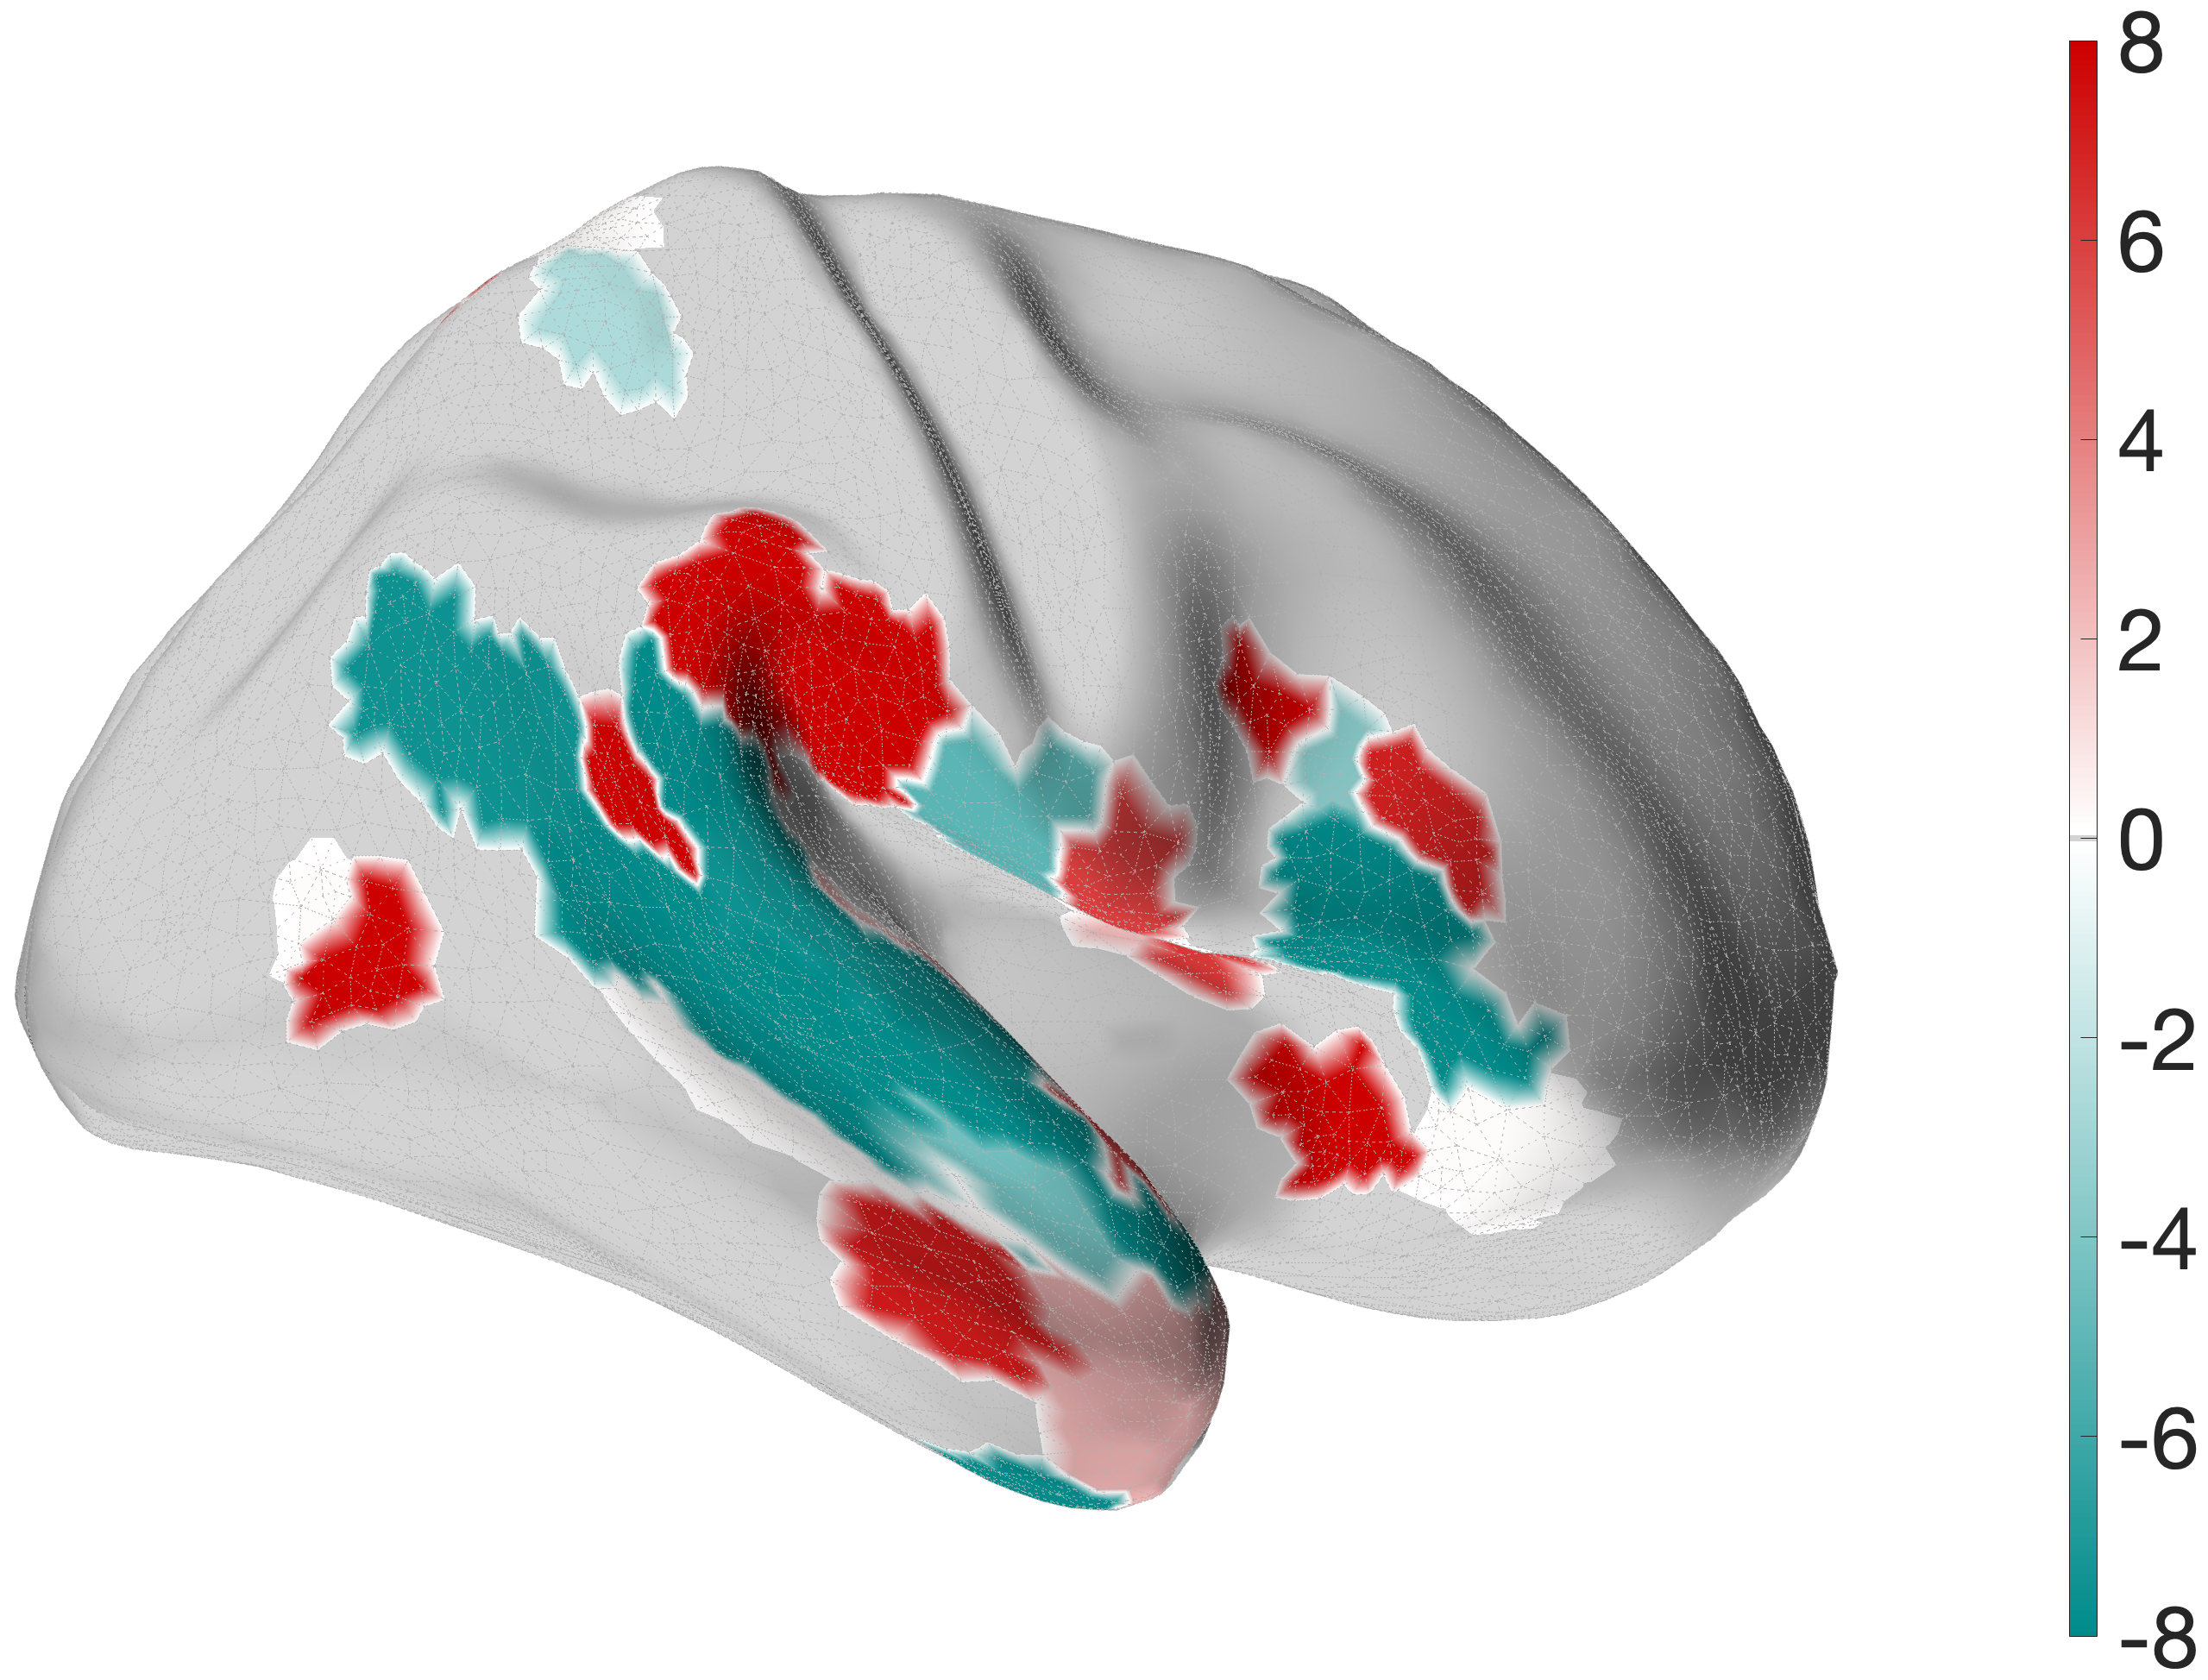
Figure 4.X: FEF versus 55b partial correlation projected onto the cortical surface, left (A) and right (B) hemisphere. Red shading indicates preferential FEF coupling; green shading indicates preferential 55b coupling. The spatial contrast between parietal (FEF-dominant) and temporal (55b-dominant) cortex visually confirms the functional dissociation between the spatial control hub and the language relay.Interestingly, 55b shows no significant coupling to spatial areas in the parietal lobe, but maintains strong direct coupling with auditory association areas A5 (left: , right ) and A4 (right: ). The latter connections are mostly absent in the FEF profile (only in the left hemisphere to A4, , ).
4.5.4 Results of the Broca-Seed Validation
Next, we evaluate the proposed functional subdivision of Broca’s area within the auditory dual-stream architecture (Rolls et al. (2023) - Cerebral Cortex). The connectivity patterns of Areas 44 and 45 were independently assessed using partial correlation to isolate direct functional pathways.
The comparative analysis reveals that Area 45 couples more strongly with semantic temporal areas than Area 44; in the right hemisphere, this extends to a stronger coupling with 55b. Area 44, by contrast, shows stronger coupling with 55b in the left hemisphere.
Area 45: The Ventral Anchor
Area 45 exhibits broad integration into the ventral what-stream, with its connectivity profile extending extensively into the temporal lobe (e.g., STSdp: left , ; right , ) and demonstrating strong coupling with PSL (left , ; right , ). Although the visualisation may suggest coupling with superior parietal (7AL, 7Am, 7PC) and premotor areas (FOP3), the corresponding mean connectivity values are near-zero or negative (), indicating that these statistically detected associations do not reflect meaningful functional coupling strength. This robust temporal-prefrontal coupling firmly anchors Area 45 as a core semantic node within the Broca complex. In contrast to Area 44, Area 45 alone shows direct coupling with early auditory areas A4 and A5 (e.g., A5: left , ), indicating that the gateway between early acoustic processing and the Broca complex runs specifically through Area 45.Area 44: The Motor-Articulatory Interface
Area 44 reveals a fundamentally different architecture. Rather than coupling with the temporal-semantic network, its significant connectivity is concentrated in the anterior ventral insula (AVI: left , ; right , ), the premotor language node 55b (left , ), and IFJa (left , ; right , ). Additionally, Area 44 shows a direct coupling with FEF (right: , ), providing a direct link to the dorsal spatial control hub. Regions such as MT, MST, and PFop show near-zero or negative partial correlation values (), confirming the absence of integration with parietal and motion-sensitive areas. This suggests that 44 plays a role in connecting semantics from ‘what’-stream to articulatory output via 55b.
Link zum Original
4.6 Behavioural Prediction
To validate the functional relevance of the resting-state networks identified in sections 4.2–4.5, we assessed whether individual differences in RSFC could predict performance on two in-scanner fMRI tasks and one out-of-scanner behavioural measure from the HCP battery.
All analyses show the ROIs of the right hemisphere, since the left hemisphere did not show significant results, following a paradigm considering the design of the tasks. The omission of significance in the left hemisphere is discussed in 5.5.4.6.1 “What” Stream: Predicting Semantic Processing Speed
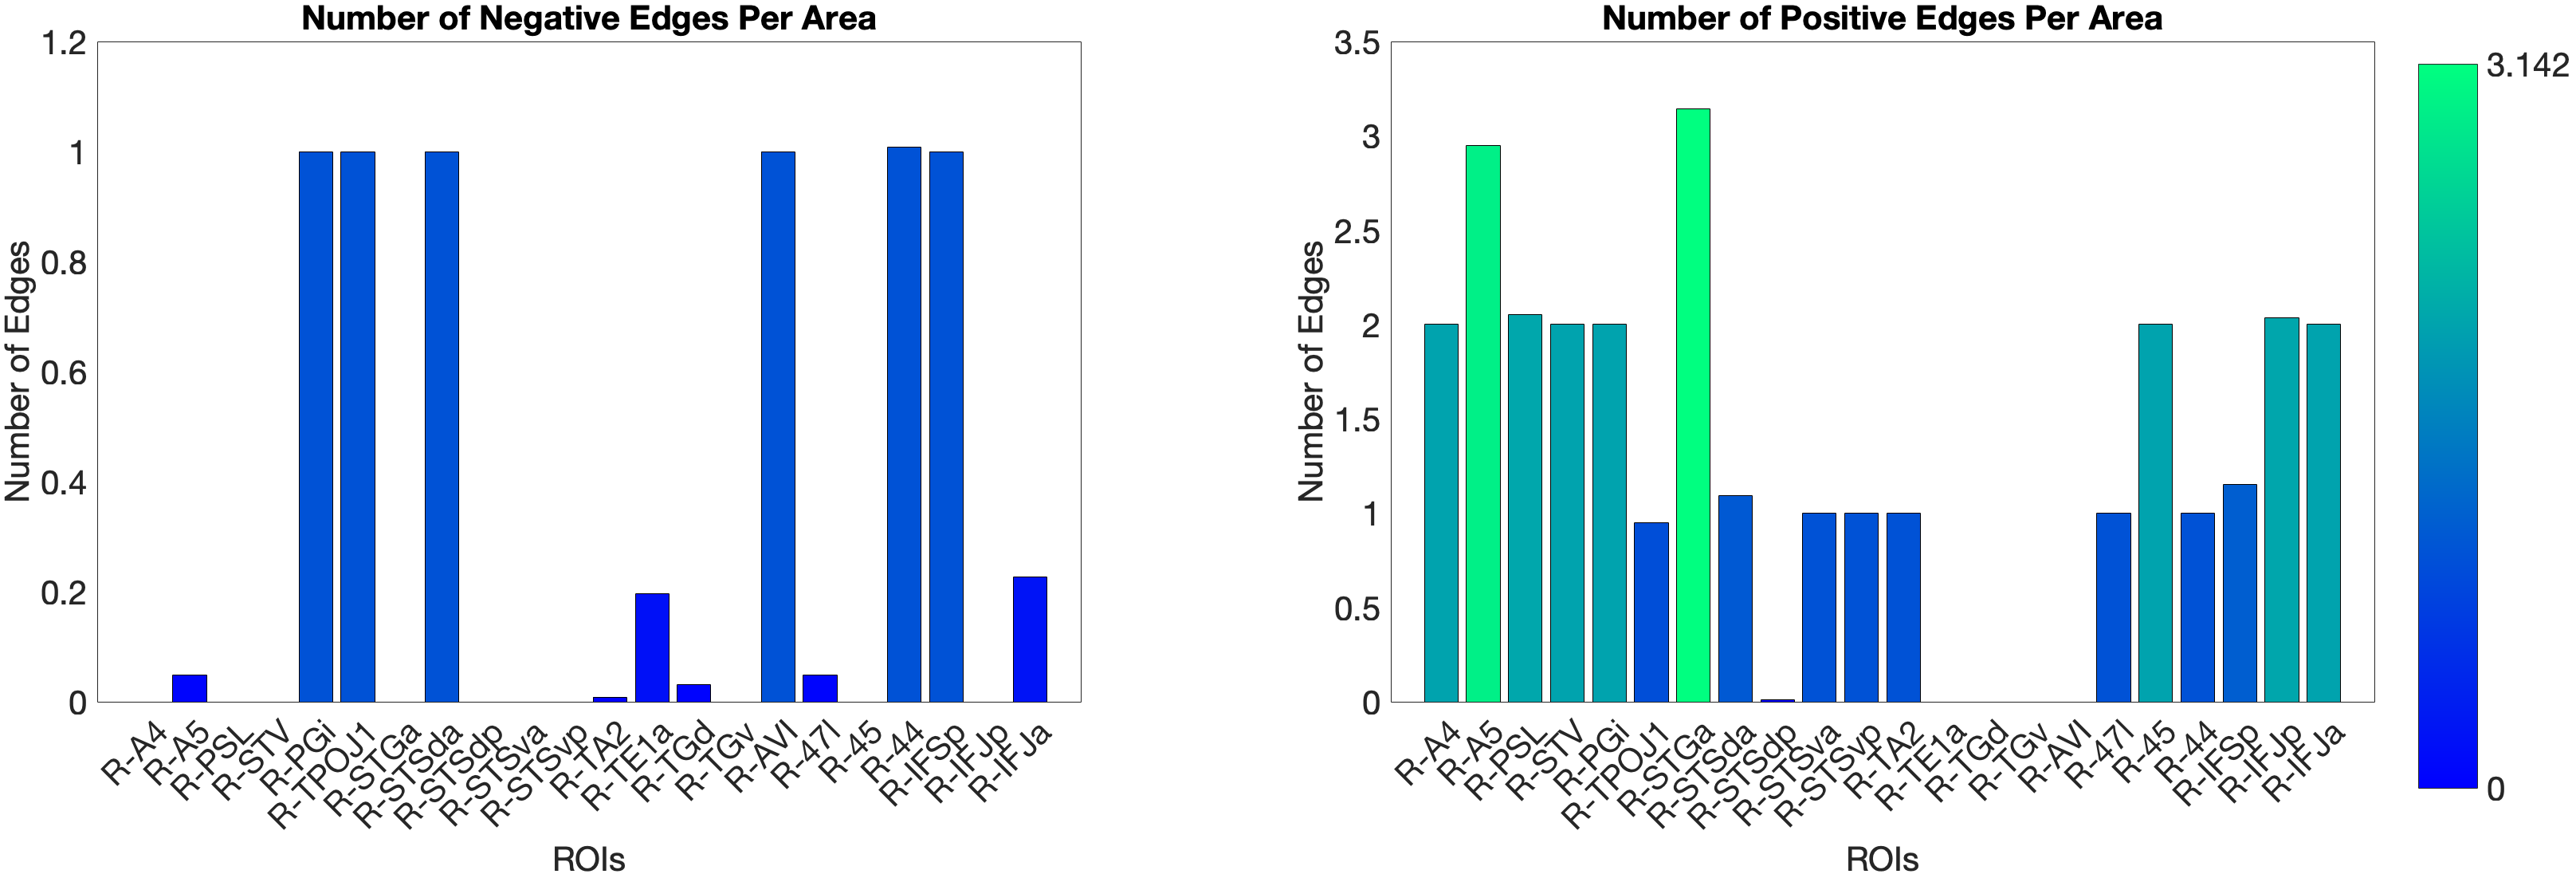
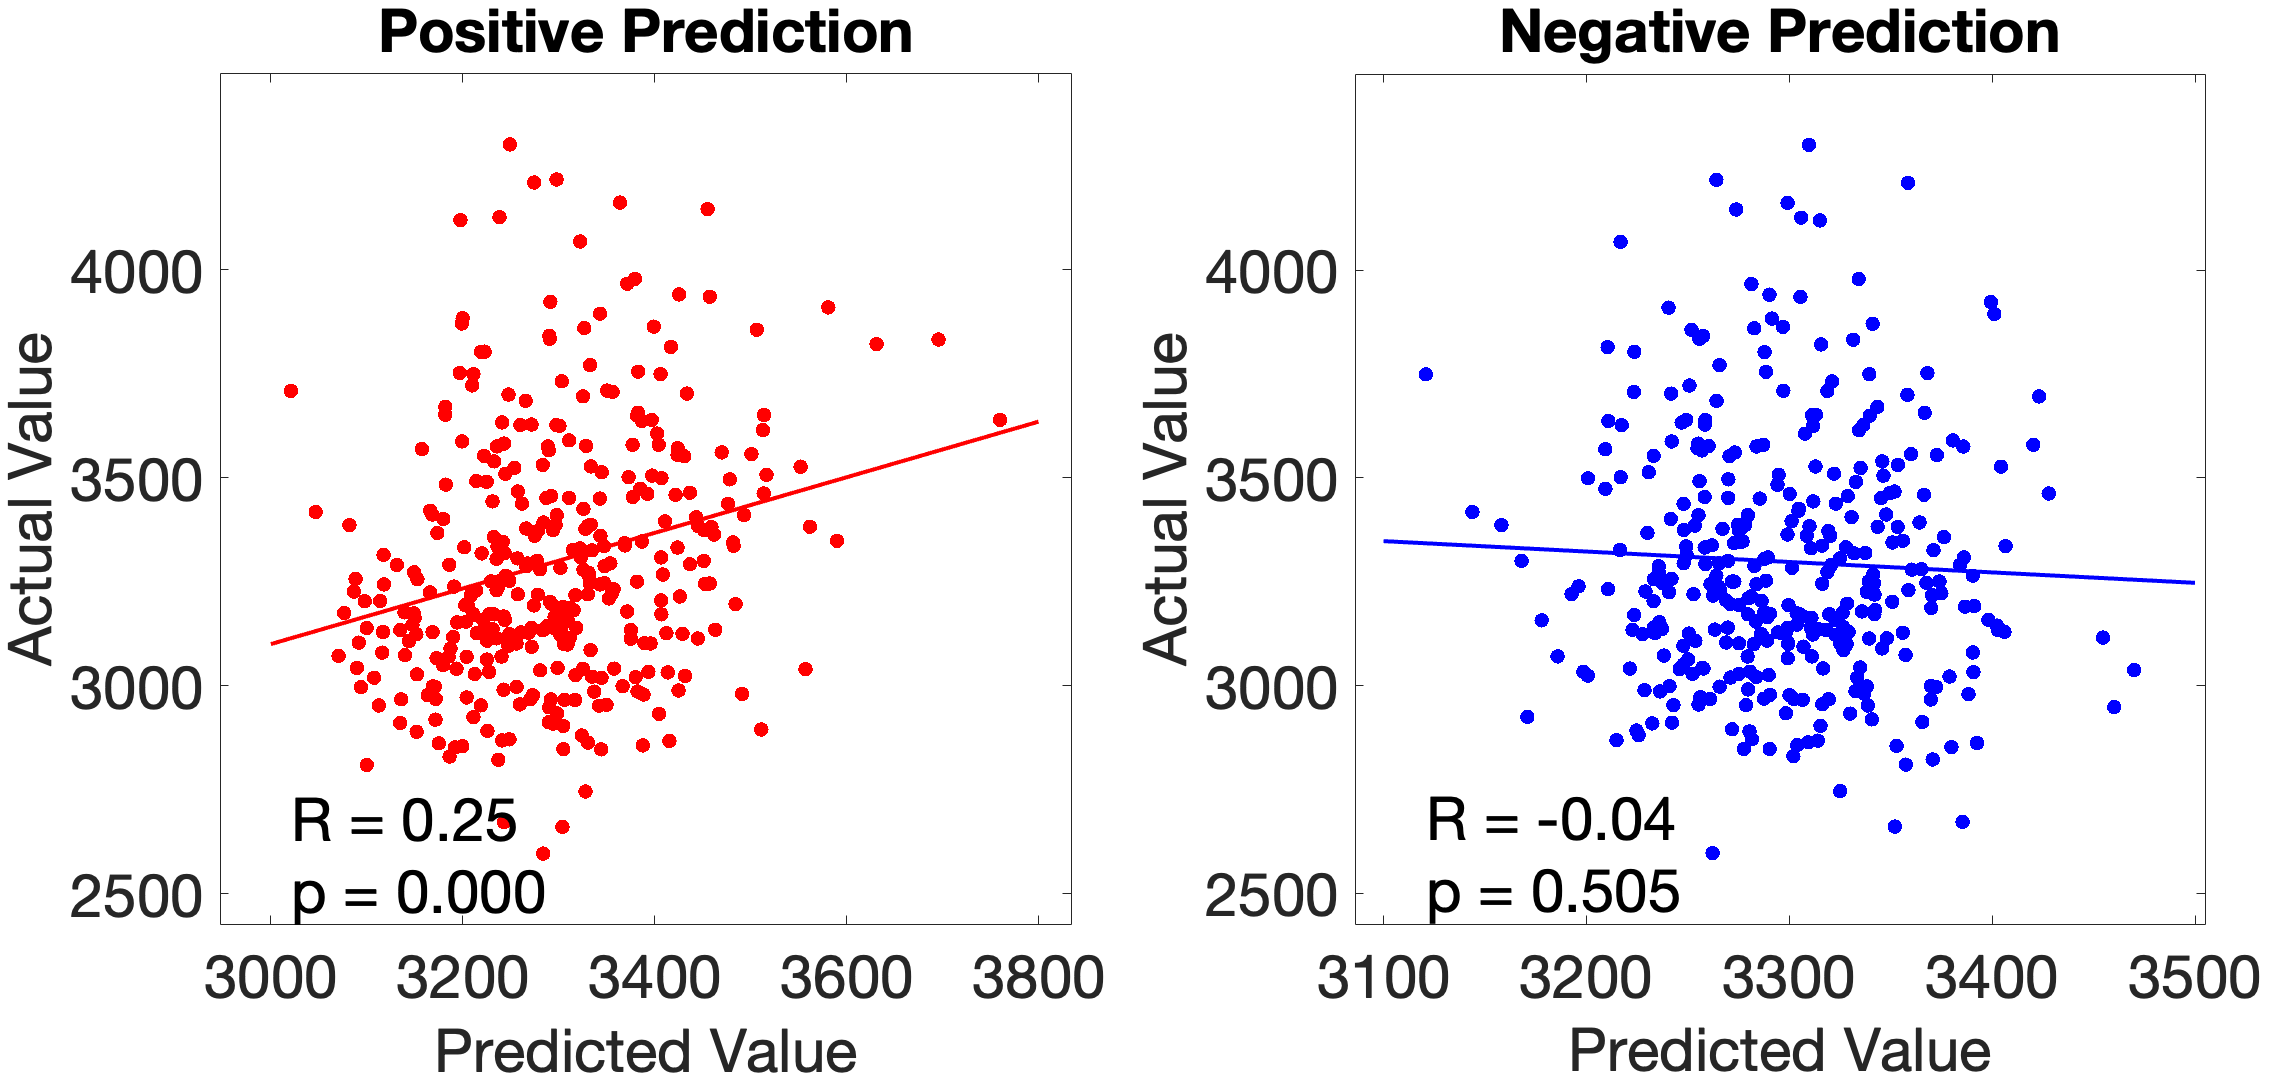
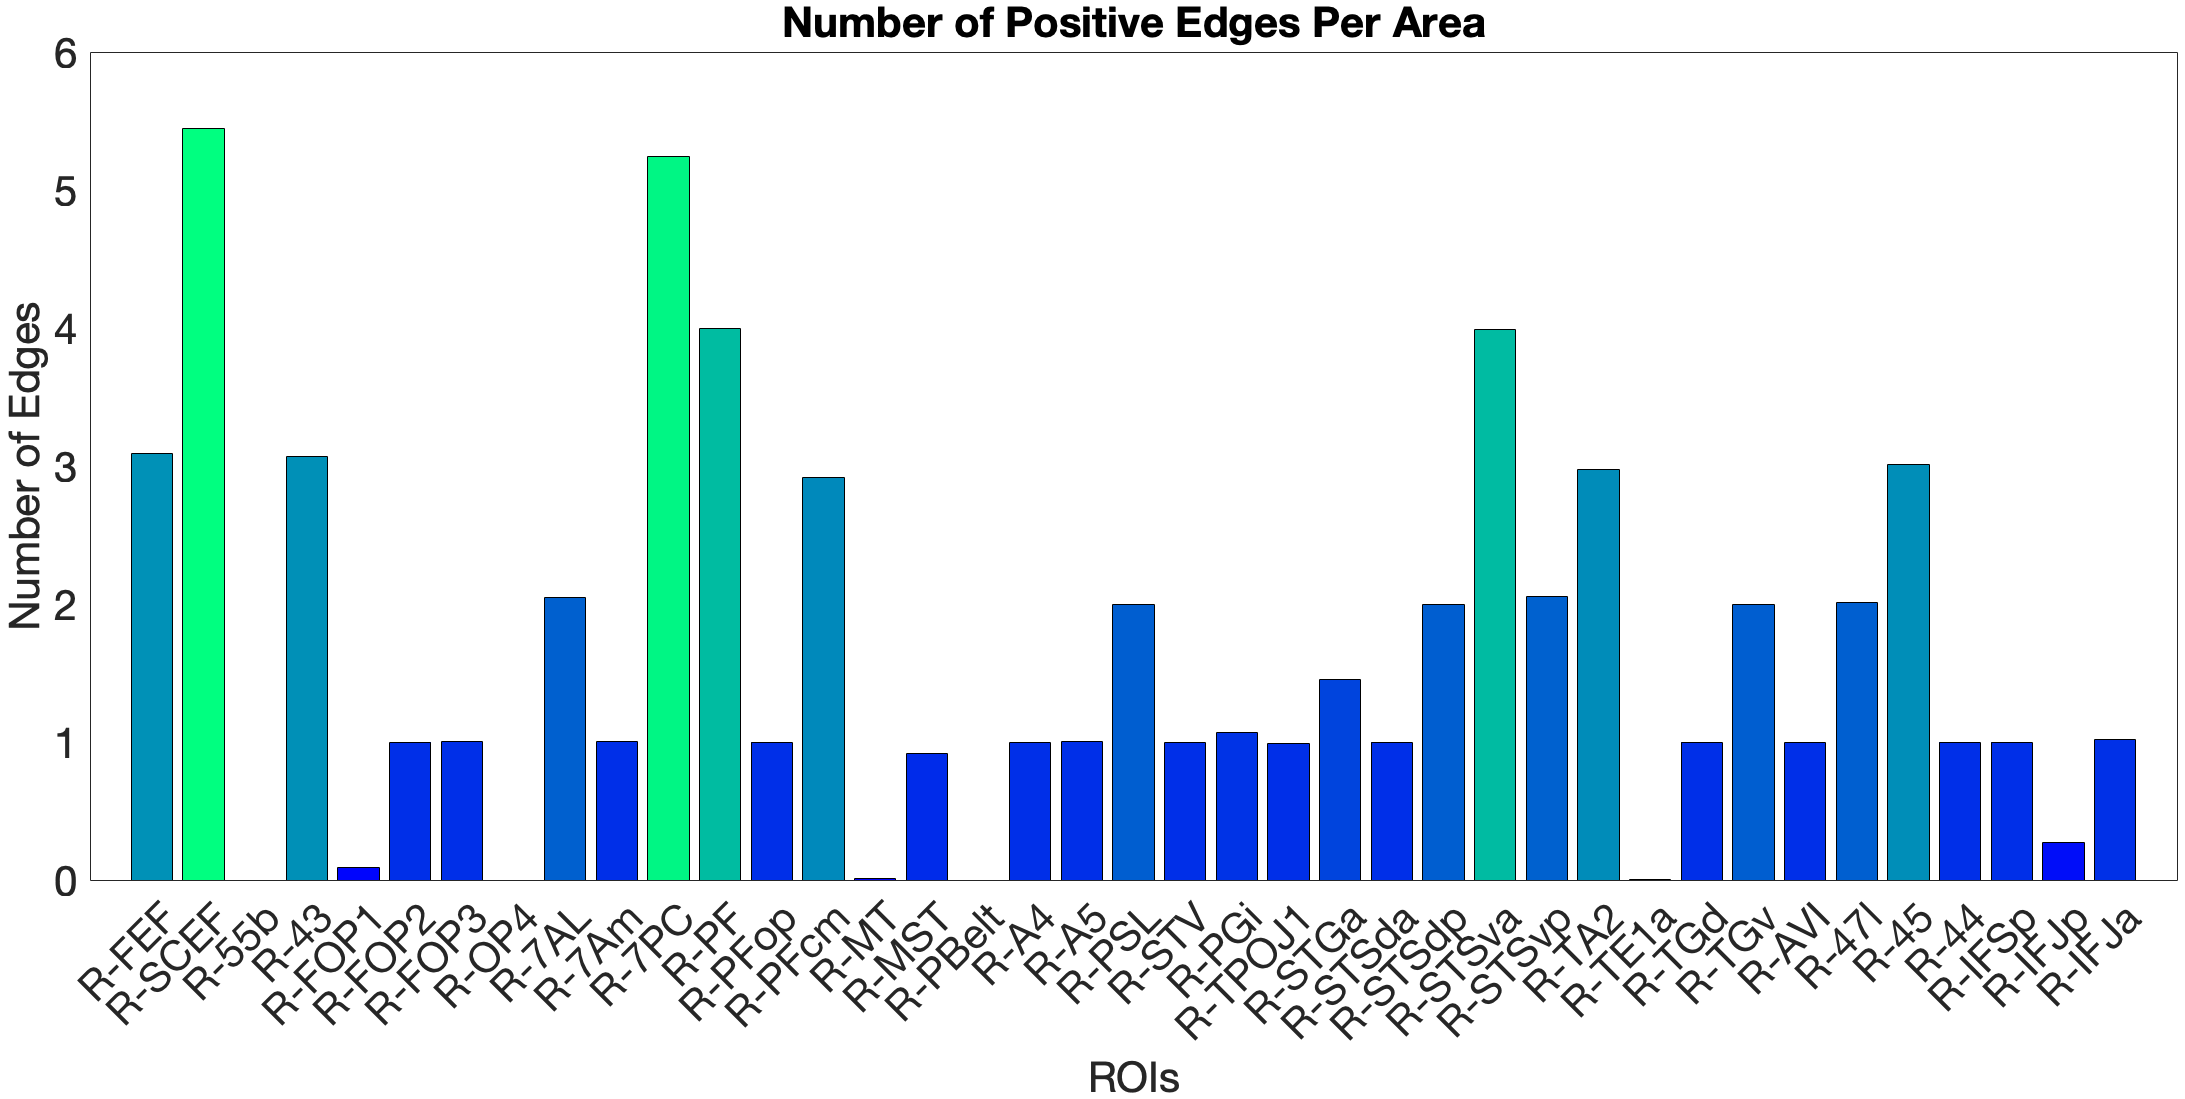
The main test of the ventral ‘what’ stream hypothesis used the Language Task Story median reaction time (Median RT). The ventral ROI model significantly predicted story Median RT (, ), with areas A5 and STGa as the strongest positive predictors, meaning that stronger resting-state coupling to areas A5 and STGa was associated with faster response times. The dorsal ROI model did not reach significance (, n.s.). This provides a clean dissociation: the semantic ‘what’ network predicts language comprehension speed, while the spatial ‘where’ network does not (Figure 4.X).
Figure 4.X: Number of predictive edges per area for the ventral ROI model predicting Language Story Median Reaction Time (right hemisphere; partial correlation, K = 371 leave-one-out cross-validation). Each bar represents the number of resting-state functional connectivity edges involving that area that contributed to the cross-validated prediction. Areas A5 and STGa emerge as the strongest positive predictors, meaning that stronger resting-state coupling of these areas to the ventral network is associated with faster semantic processing speed. The dorsal ROI model did not reach significance (R = 0.04, n.s.), confirming that this behavioural prediction is specific to the ‘what’-stream network.
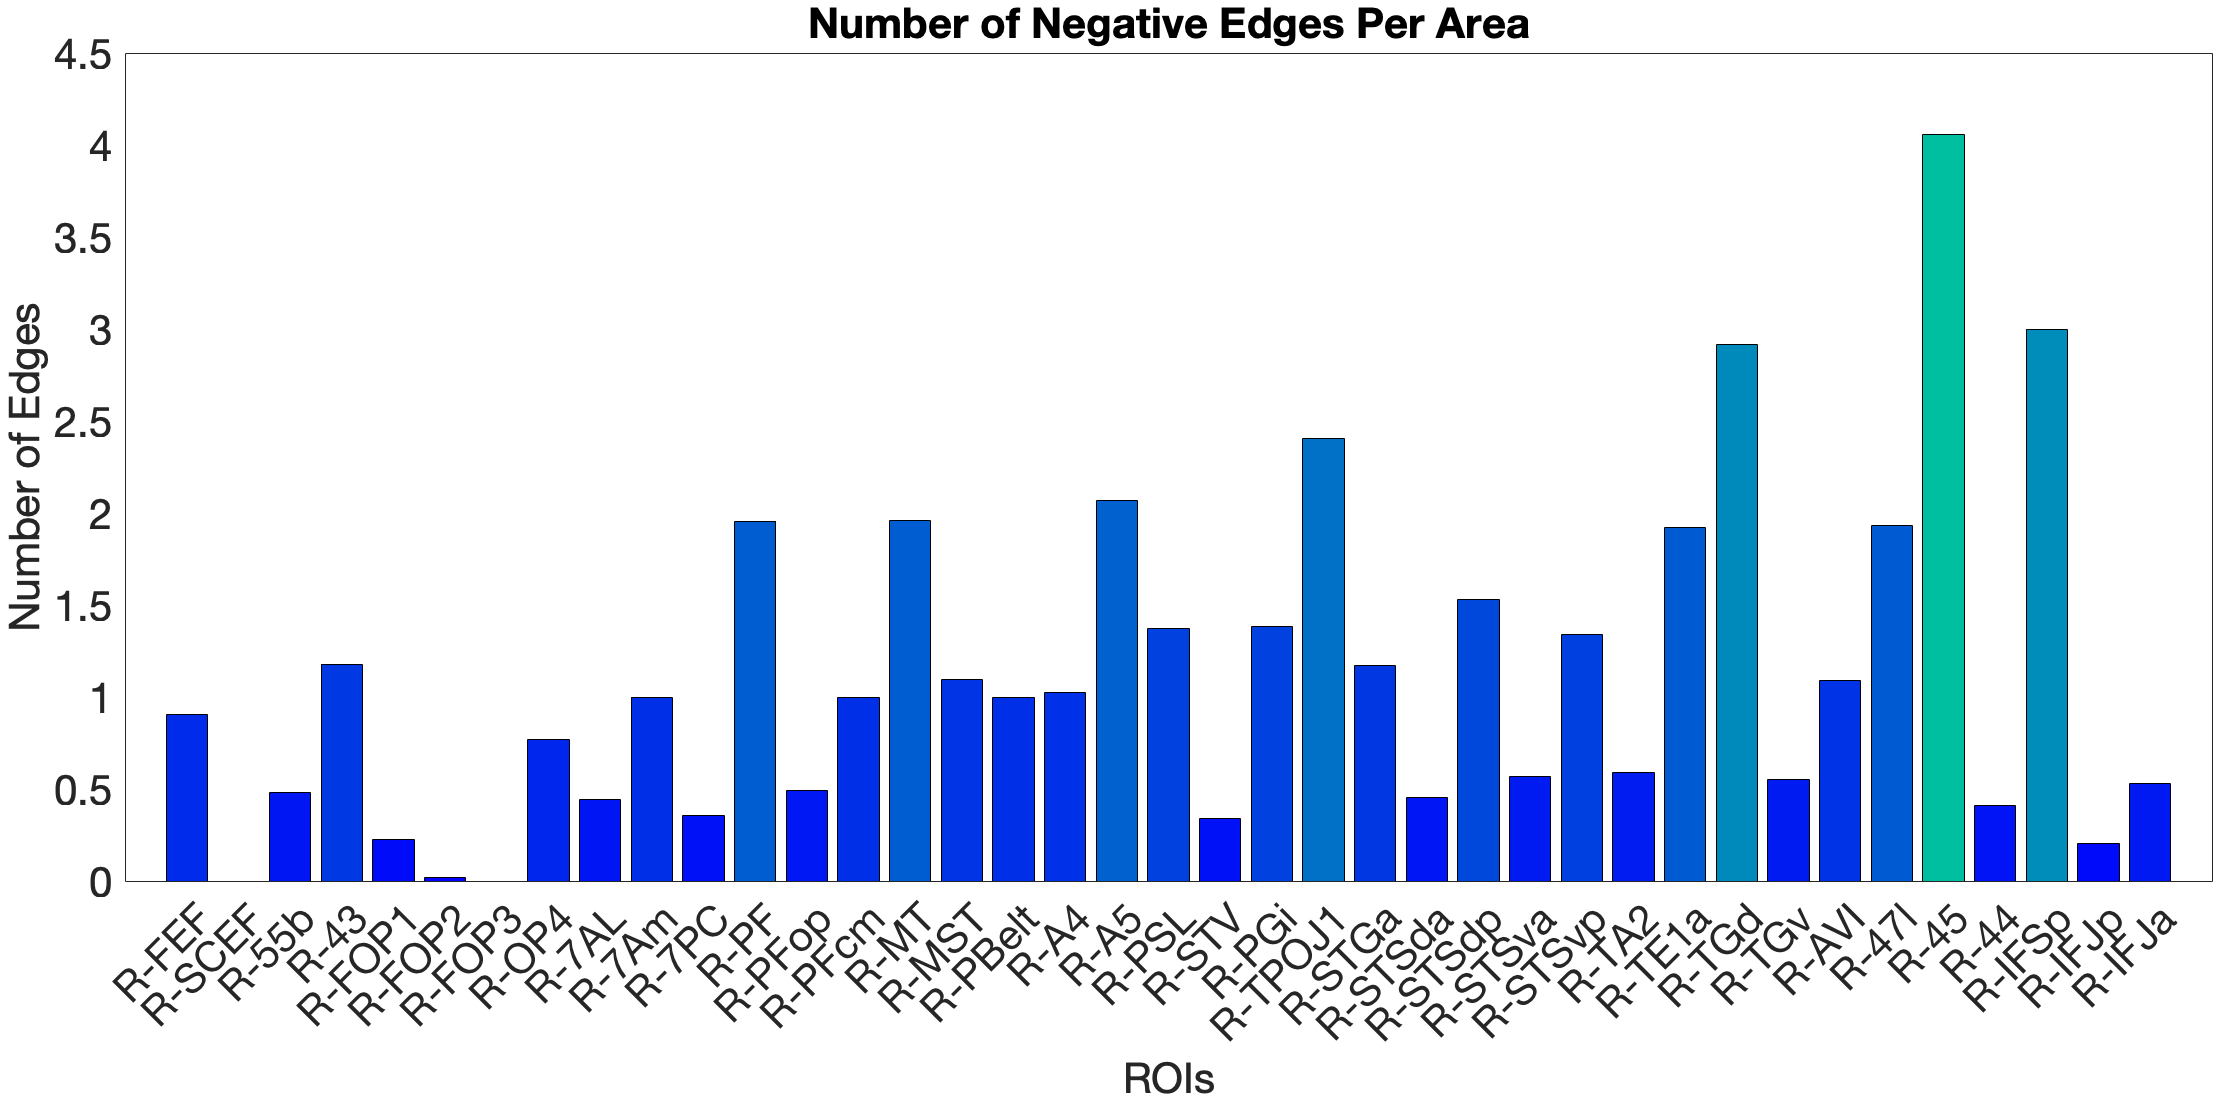
Figure 4.X: Cross-validated p-values for the Language Story Median RT prediction, ventral ROI model (right hemisphere; partial correlation, K = 371). Bars indicate significance of the cross-validated correlation per area, confirming that the ventral stream prediction is robust across leave-one-out cross-validation folds.On the other hand, the story accuracy (Acc) shows different results. The full network predicted story Acc (, ) and both the ventral (, ) and dorsal (, ) submodels reached significance. Interestingly, area 45 presents itself as a negative predictor for accuracy, meaning stronger Area 45 coupling was associated with lower accuracy. The ‘where’-stream’s accuracy was driven by areas 43 and PF (Figure 4.Y).
Figure 4.Y: Number of predictive edges per area for all ROI model predicting Language Story Accuracy (right hemisphere; partial correlation, K = 371 leave-one-out cross-validation). Area 45 emerges as a negative predictor, meaning stronger resting-state coupling to Area 45 is associated with lower story comprehension accuracy — consistent with an interference effect in which engagement of deep syntactic processing disrupts comprehension of semantically simple narratives. Area STSva contributes as the main positive predictor. Both the dorsal (R = 0.24, p < .001) and full-network (R = 0.38, p < .001) models also reached significance, indicating that story accuracy — unlike Median RT — reflects distributed network contributions rather than ventral-stream specificity alone.4.6.2 Acoustic Signal Filtering (Noise Comparison)
As a control task for low-level acoustic signal filtering, we chose the NIH Toolbox Noise Comparison. The ‘what’-pathway fails to predict this task (n.s.). In the full-network model (, ) and the ‘where’-stream model (, ), we observed significant predictions. In the full-network model, area PFcm was the dominant positive predictor, with FOP3 as the main negative predictor. The ‘where’-stream submodel showed a different pattern: OP4 was the main positive predictor, while FOP3, 7AL and PBelt were the negative ones. Both models show leading predictors in opercular and parietal rather than prefrontal areas. This means RSFC in the semantic network does not generalise to acoustic noise exclusion.
4.6.3 Predicting Visuo-Spatial Working Memory
We tested the dorsal ‘where’-stream hypothesis against Working Memory Task Place accuracy (Place Acc) and reaction time (Place RT). In the full-network model (, ), SCEF and AVI were the strongest positive predictors. Notably, FEF did not emerge as a significant predictor — a null result given its hypothesised role as the primary dorsal prefrontal hub (Salmi (2009), see section 2.2.3). The dorsal submodel yielded a negative cross-validated R (, ), driven by areas 7AL and 7Am. The ventral submodel predicted Place Acc positively (, ), driven by area 47l.
For Place RT, the dorsal model produced an artefactual result () due to matrix rank collapse and is excluded from interpretation (see section 5.7). The ventral model yielded a marginally significant prediction (, ), with STSda as positive and IFJa as negative predictor. The full-network model (, ) identified MT and TA2 as negative and PSL as positive predictor.
An overview of cross-validated prediction results across all tasks and models is provided in Table 4.X. A complete listing of all target regions of interest with their final stream assignments — including areas reclassified on the basis of partial correlation results (Sections 4.4.1–4.4.3) — is provided in Appendix Table A2.
Table 4.X: Cross-validated prediction of behavioural performance from resting-state functional connectivity (right hemisphere; partial correlation, K = 371). †Dorsal WM Place RT model excluded due to matrix rank collapse.
Task Model R p Key predictors Language Story Median RT Ventral 0.18 .001 A5, STGa (+) Language Story Median RT Dorsal 0.04 n.s. — Language Story Median RT Full 0.07 n.s. — Language Story Acc Ventral 0.32 <.001 STSva (+), 45 (−) Language Story Acc Dorsal 0.24 <.001 43, PF (+) Language Story Acc Full 0.38 <.001 SCEF, 7PC (+), 45 (−) Noise Comparison Ventral −0.07 n.s. — Noise Comparison Dorsal 0.17 .001 OP4 (+), FOP3, 7AL, PBelt (−) Noise Comparison Full 0.22 <.001 PFcm (+), FOP3 (−) WM Place Acc Ventral 0.20 <.001 47l (+) WM Place Acc Dorsal −0.15 .004 7AL, 7Am (+) WM Place Acc Full 0.14 .007 SCEF, AVI (+) WM Place RT Ventral −0.11 .035 STSda (+), IFJa (−) WM Place RT Dorsal† — — — WM Place RT Full −0.20 <.001 PSL (+), MT, TA2 (−)
Link zum Original